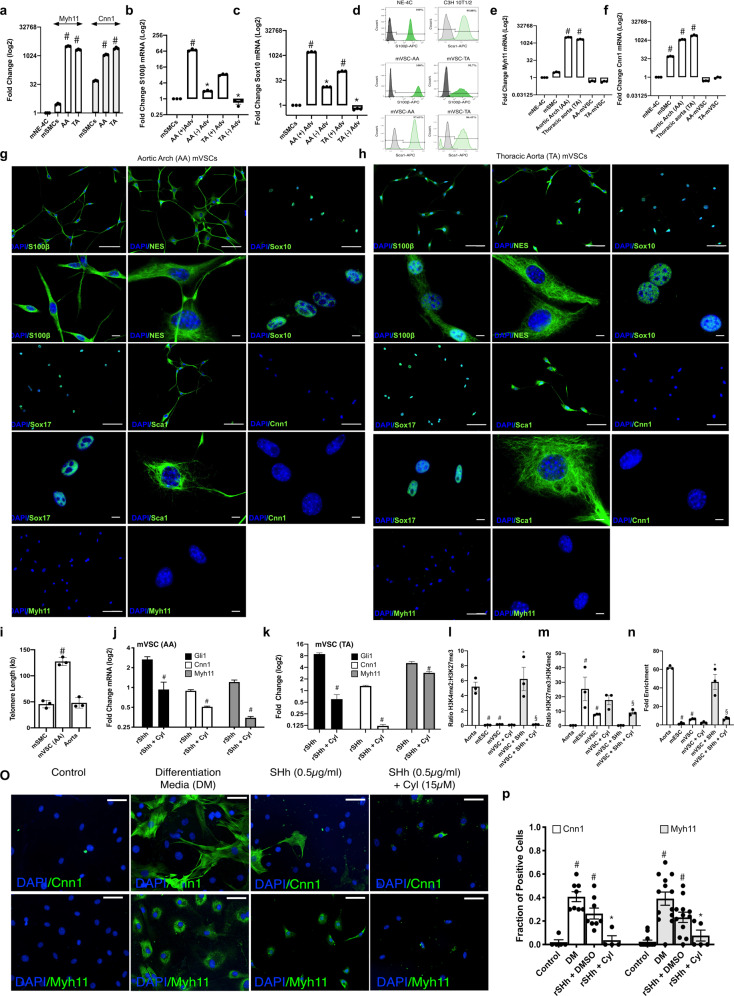
Fig. 5. Resident S100β/Sca1 vascular stem cells from atheroprone and atheroresistant regions of the mouse aorta in vitro.
a Relative levels of Myh11 and Cnn1 in AA and TA regions of the mouse aorta. Data are expressed as the Log2 fold change in mRNA levels relative to neural stem cells (NE-4C) in culture and are the mean ± SEM of three aortic specimens, #p ≤ 0.05 vs NE-4C cells. The housekeeping gene Gapdh was used as a control. b, c The level of enrichment of mRNA for neuroectodermal markers b S100β and c Sox10 within atheroprone AA (aortic arch) and atheroresistant TA (thoracic/descending aorta) regions of the mouse aorta in the absence or presence of the adventitial (Adv) layer. The housekeeping gene hypoxanthine guanine phosphoribosyltransferase (hprt) was used as a control. Data are expressed as the Log2 fold change in mRNA levels relative to murine aortic SMCs in culture and are the mean ± SEM of three aortic specimens, #p ≤ 0.05 vs MOVAS SMCs. d Flow cytometry analysis of vSCs isolated from AA and TA regions of the mouse aorta and grown in maintenance media for S100β (dark green) and Sca1 (light green) expression. NE-4C and CH3-10T1/2 cells were used as positive controls, respectively. Filled dark and light green curves represent negative control samples. e, f Relative levels of e Myh11 and f Cnn1 in vSCs isolated from AA and TA regions of the mouse aorta, compared to AA and TA aortic tissue. Data are expressed as the Log2 fold change in mRNA levels relative to neural stem cells (NE-4C) in culture and are the mean ± SEM of three independent cultures and three aortic specimens, #p ≤ 0.05 vs NE-4C cells. g, h Representative immunocytochemical analysis of stem cell markers S100β, Nestin, Sox10, Sox17, Sca1, and SMC differentiation markers, Cnn1 and Myh11 in vSCs isolated and grown in maintenance media (MM) from g AA and h TA regions of the mouse aorta. Scale bar 20 µm. i Absolute telomere length of vSCs compared to cultured MOVAS SMC and fresh aortic tissue. The telomere primer set recognizes and amplifies telomere sequences. The single copy reference (SCR) primer set recognizes and amplifies a 100 bp-long region on mouse chromosome 10, and serves as reference for data normalization. Data are expressed as absolute telomere length (kb) and are the mean ± SEM of three plates and aortic specimens, #p ≤ 0.05 vs MOVAs SMCs. j, k Relative levels of Gli1, Myh11 and Cnn1 within vSCs isolated from j AA and k TA regions of the mouse aorta in the absence or presence of rSHh (0.5 µg/ml) with or without the smoothened inhibitor, cyclopamine (10 µM). Data are expressed as the Log2 fold change in mRNA levels relative to vSCs alone (control) and are the mean ± SEM of three representative wells from two independent experiments, #p ≤ 0.05 versus rSHh alone. l–m ChiP analysis of the ratio of l H3K4me2:H3K27me3 and m H3K27me3:H3K4me2 enrichment at the Myh11 locus in AA vSCs in the absence or presence of rSHh (0.5 µg/ml) with or without cyclopamine (10 µM) for 7 d. n Fold enrichment of H3K4me2 at the Myh11 locus in AA vSCs in the absence or presence of rSHh (0.5 µg/ml) with or without cyclopamine (15 µM) for 7 d. Fresh aortic tissue and mouse ECSs was used as positive and negative controls, respectively Data are the mean ± SEM, n = 3, #p ≤ 0.05 versus aorta/ESC, *p ≤ 0.05 vs vSC, §p ≤ 0.05 vs rSHh. o Representative immunocytofluorescence staining and p the fraction of Cnn1 and Myh11 positive cells in the absence or presence of rSHh (0.5 µg/ml) with or without cyclopamine (15 µM) for 7 days. Representative images shown, Scale bar = 50 µm. Cumulative data is the mean ± SEM, n = 3, #p ≤ 0.05 versus control, *p ≤ 0.05 vs rSHh.

