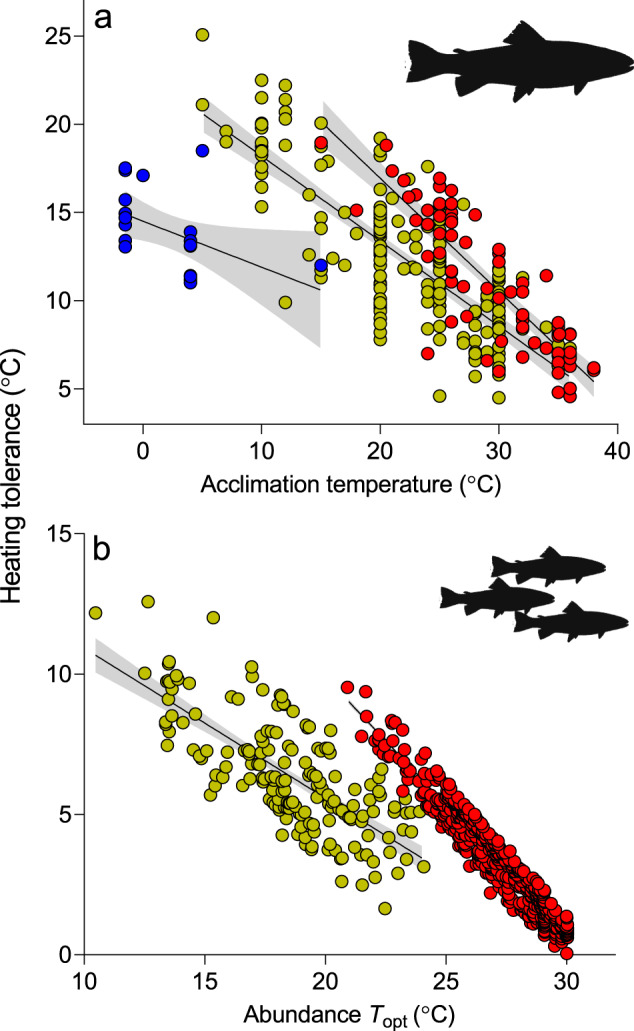
Fig. 2. Fish heating tolerances at different biological scales.

a At the individual level, physiological heating tolerance is CTmax − Ta, and b at the population level, population heating tolerance is Tlim − Topt (as per Fig. 1). Tropical, temperate and polar species are indicated by red, yellow and blue, respectively. For panel a, each symbol represents a mean measurement (n = 269) from 121 different species, and for b, each symbol represents a different species (n = 702). Lines represent regression mean and 95% CIs.
