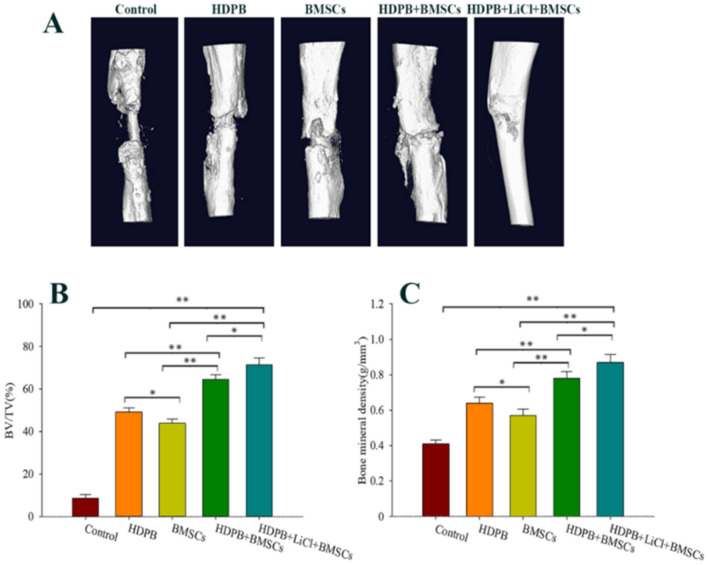
Figure 7.
Micro-CT 3D reconstruction image and quantitative analysis results of bone defect area 8 weeks after the injury. (A) Representative three-dimensional reconstruction image at 8 weeks after the injury. (B) Eight weeks after the surgery, the percentage of new bone volume in each group of bone defect segments *P < 0.05, **P < 0.01. (C) Bone mineral density analysis results of bone defect segments in each group at 8 weeks after surgery, *P < 0.05, **P < 0.01. Five samples were taken from each group for analysis, and the data were plotted in the format of mean ± standard deviation.

