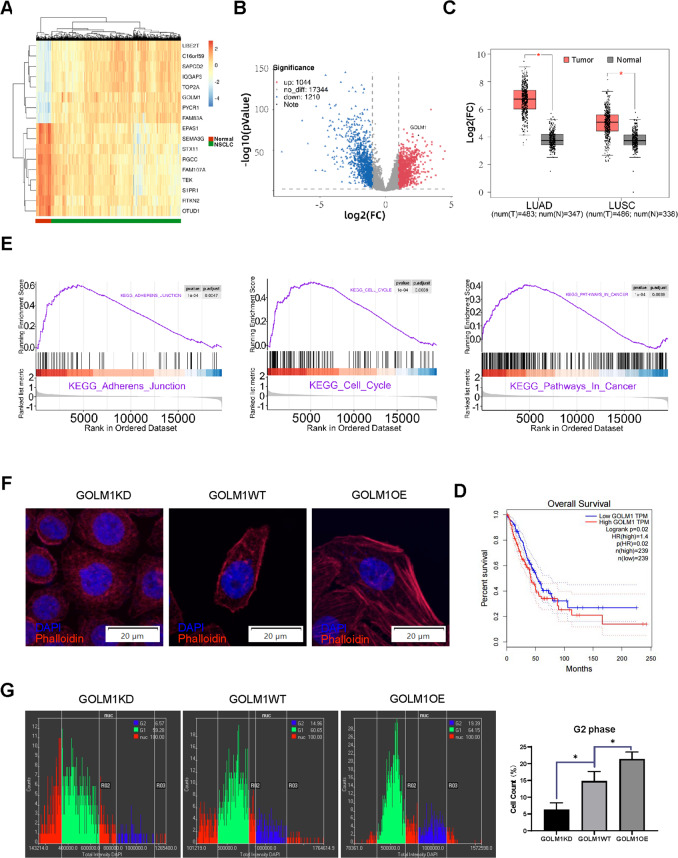
Fig. 1. GOLM1 is highly expressed in patients with non-small cell lung cancer whose expression level is negatively correlated with patients’ OS.
A Heatmap of expression levels of suspect candidate differentially expressed genes (DEGs) in NSCLC patients from TCGA dataset. B The DEGs volcano map in TCGA dataset (GOLM1 was marked). C Expression levels of GOLM1 in lung adenocarcinoma (LUAD) and squamous cell lung carcinoma (LUSC) from TCGA dataset. Pink refers to tumor group, Grey refers to normal group. (Data were means ± SEM. *P < 0.05). D Overall survival (OS) of the lung adenocarcinoma patients with GOLM1 high expressing level against low expressing level. E Single gene GSEA analysis of KEGG reference gene sets for GOLM1 high expression groups against low expression groups from TCGA dataset. F Actin polymerization was assessed through immunofluorescence assays. Red fluorescence represents Phalloidin, and blue (DAPI) represents cell nucleus. G The cell-cycle assay through high content screening (HCS) system and the statistical analysis of cell count (%) in G2 phase among GOLM1KD, GOLM1WT, and GOLM1OE group. GOLM1KD = GOLM1 knockdown group, GOLM1WT = wild-type group, GOLM1OE = GOLM1 overexpression group. Data were means ± SEM. *P < 0.05, n = 3.

