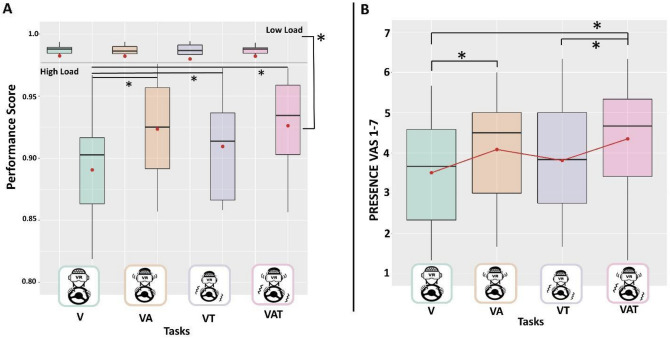
Figure 2.
Boxplots representing behavioural correlates of the (A) Performance Index for the low load condition (top) and high load condition (bottom) for each sensory task; (B) presence questionnaire scores across the sensory tasks. The questionnaire proposed at the end of each run consisted of three items on a scale from 1 to 7. These scores were averaged to obtain a single value for each condition. The black asterisks indicate significant post-hoc tests while red dots and lines refer to the mean. The central line represents the median, the top and the bottom of the box are the first and third quartiles, and the whiskers are the interquartile range of the lower quartile and of the upper quartile multiplied by 1.5.

