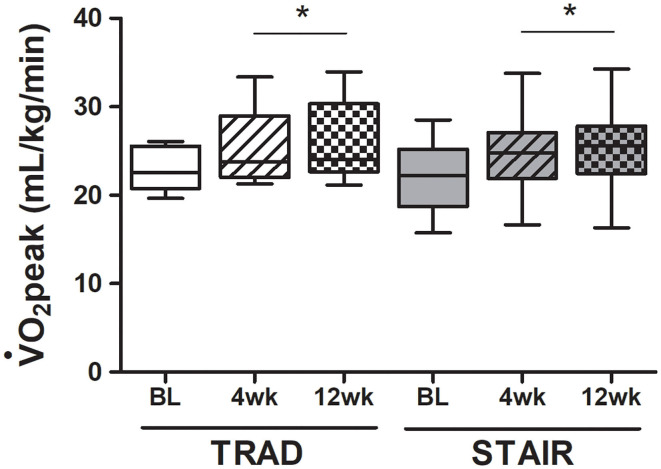
Figure 3.
V°O2peak improvements following 4 weeks of supervised and 8 additional weeks of unsupervised exercise training of both TRAD and STAIR programs. Data is reported as a boxplot with the minimum, median and maximum values represented (n = 9/group). BL, Baseline; *significantly different from Baseline (p = 0.001), using a Two-way repeated measures ANOVA.

