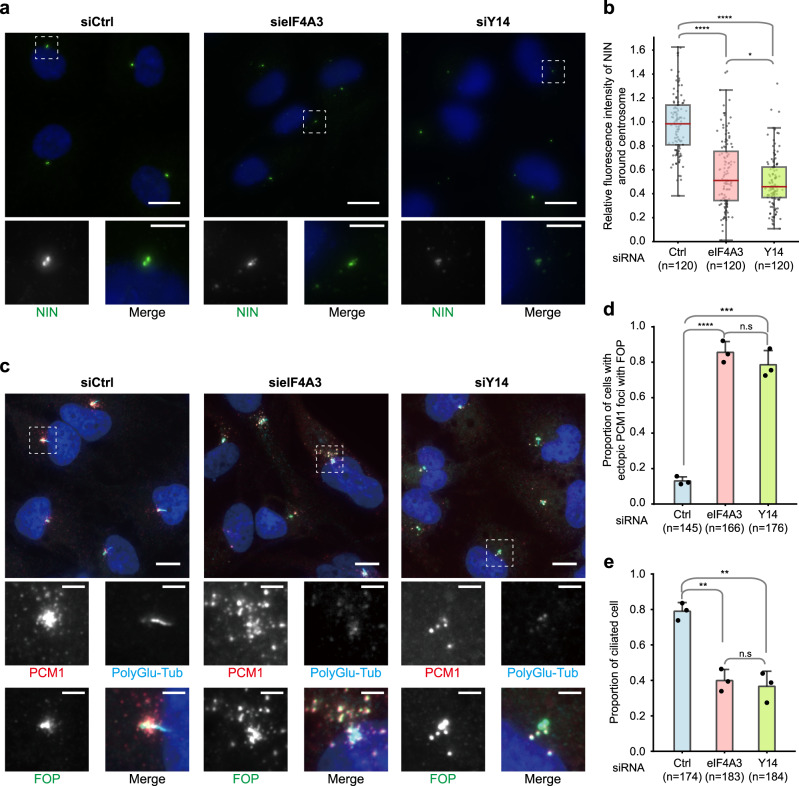
Fig. 6. Knock-down of EJC components impairs centrosome structure and primary cilia formation.
Quiescent RPE1 cells transfected with siRNAs against eIF4A3 or Y14 were stained for NIN (a) or PCM1 (centriolar satellite protein), FOP, and poly-glutamylated tubulin (PolyGlu-Tub; c). Nuclei were stained by Hoechst. Lower panels are enlarged images marked by white dashed square in the upper panels. Scale bars in the upper and lower panels are 10 and 3 μm, respectively (a, c). Images were processed by maximum intensity projections of 15 z-stacks acquired at every 0.5 μm (a). Quantification of fluorescence intensities of NIN were performed as described in the legend of Fig. 1. Boxes represent values between the 25th lower and 75th higher percentile, and the red lines mark the median. Whiskers above and below correspond to 0.35th lower and 99.65th higher percentile, respectively. The average fluorescence intensity of NIN in Ctrl siRNA treated cells is set to 1.0 (b). Proportion of cells with ectopic centriolar satellite with FOP upon the siRNA treatments indicated (d). Proportion of ciliated cells upon the indicated siRNA treatments (e). Columns and bars depict mean ± SD of three independent experiments (d, e). n.s. P > 0.05, *P ≤ 0.05, **P ≤ 0.01, ***P ≤ 0.001, and ****P ≤ 0.0001, two-tailed Mann–Whitney test (b) and two-tailed t-test (d, e). The number of cells analyzed in three independent experiments is provided (b, d, e). Source data are provided as a Source Data file.

