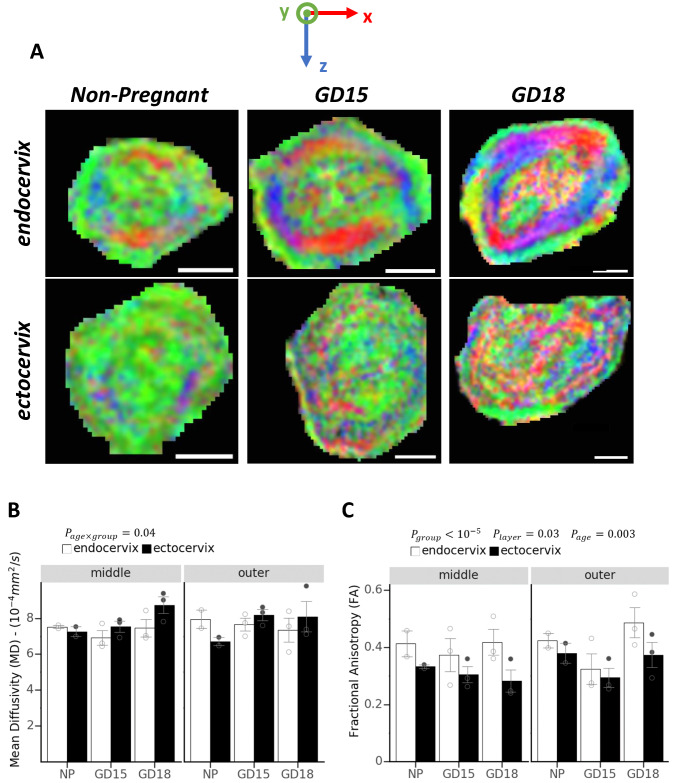
Figure 1.
Diffusion Tensor Imaging of murine endo- and ectocervix. (A) Color-coded coordinate system shows the direction of restricted diffusion of water molecules in the tissue on the transverse plane. Green color or y-direction is the direction parallel to the cervix canal. Diffusion Tensor Imaging (DTI) images of endocervix (upper panel) and ectocervix (lower panel) from non-pregnant (NP), and pregnant mice (gestational day (GD) 15 and GD18). Three distinct zones are visible in the endocervix: 1) an inner longitudinal green zone of fibers around the cervical canal, surrounded by 2) circular fibers captured in red and blue, and 3) an outer longitudinal green zone. The fibers in the ectocervix are less distinct compared to the endocervix. Images were generated through FSLeyes software (FMRIB Analysis Group, University of Oxford, version 0.22.4, https://users.fmrib.ox.ac.uk/~paulmc/fsleyes/apidoc/latest/index.html). Scale bar = 1 mm. Two measured quantities from DTI images are mean diffusivity (MD) (B) and fractional anisotropy (FA) (C) and values are compared for outer and middle layers at the endocervix and ectocervix for non-pregnant and pregnant mice at two gestational time points (15GD and 18GD). Data are shown as means ± standard error of the mean (SEM). Open and gray circles represent data points related to each group, endocervix and ectocervix respectively. Main effects of group (endocervix vs ectocervix), layer (middle vs outer), or gestational age asdetermined by a mixed effect model are noted as , , and . The interaction of gestational age and cervix location is noted as . Values of the inner layer are not included in the graphs as it was not possible to separate the cervical canal value from the inner layer. A significant lower FA in the ectocervix than the endocervix shows a less organized structure at the ectocervix. Significantly higher MD in the ectocervix compared to the endocervix also represent a less dense cellular structure. Variations in diffusion parameters were also observed based on layer location and through gestational progress.

