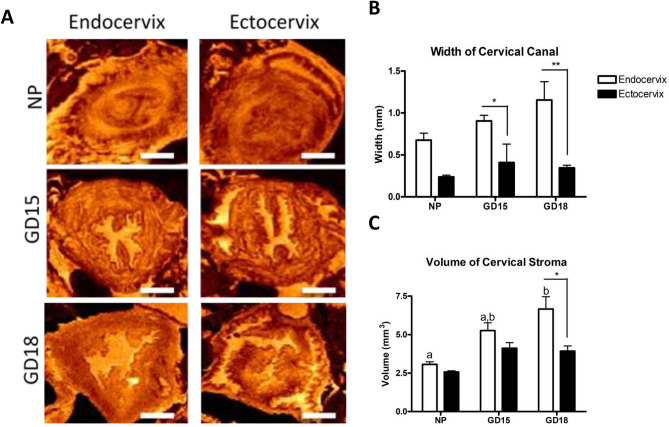
Figure 3.
Analysis of ex-vivo T2-weighted images of the murine cervix. (A) The transverse plane of murine endocervix (left) and ectocervix (right) are imaged in non-pregnant (NP) and pregnant mice during mid-gestation (GD15) and late gestation (GD18), indicating that the cervical tissue and canal become wider as labor approaches. Images were generated through MNI Display (McGill Centre for Integrative Neuroscience, version 2.0.6, http://www.bic.mni.mcgill.ca/software/Display/Display.html). The orange color indicate the level of tissue hydration (brighter colors indicates more hydrated regions). Scale bar = 1 mm. (B),(C) Width and volume measurements by MNI Display (McGill Centre for Integrative Neuroscience, version 2.0.6, http://www.bic.mni.mcgill.ca/software/Display/Display.html) are shown as mean ± SEM. Results confirm that at late gestation (GD18) the canal and tissue in the region of the endocervix (white bars) is significantly larger than in the ectocervix (black bars), and these parameters are significantly different from the NP cervix. Statistical significance was determined by two-way ANOVA with Bonferroni post-test. Letters indicate significant differences in the endocervix volume across gestation. Asterisks indicate differences between the endocervix and ectocervix from the same gestational day. *p < 0.05;**p < 0.01. (n = 3–4/GD).

