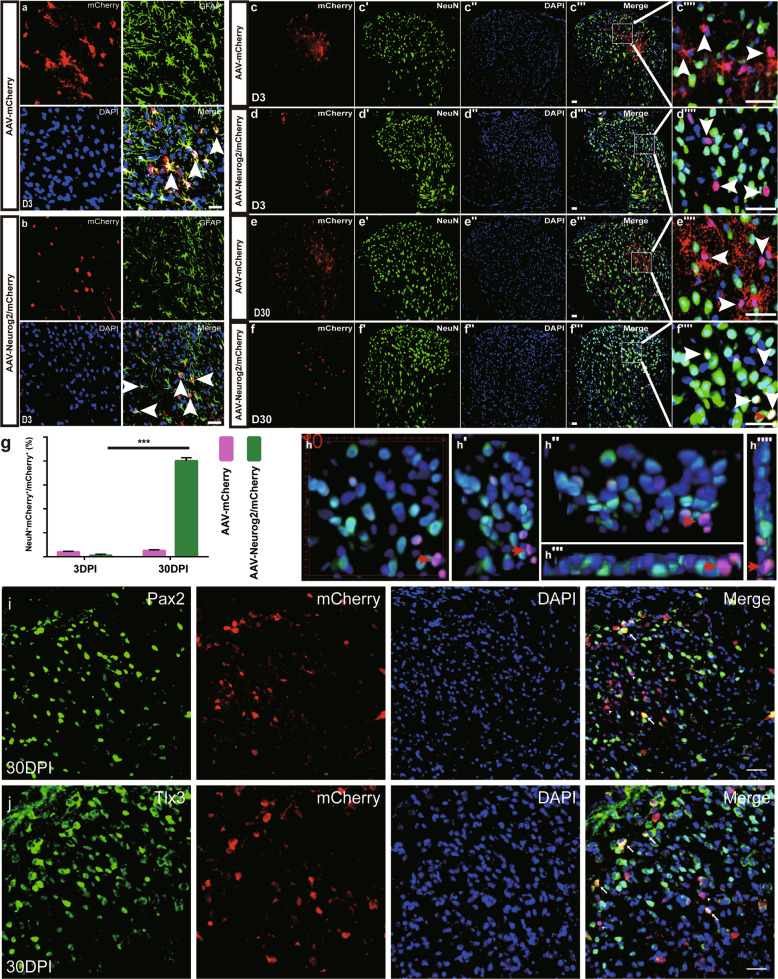
Fig. 4. Neurog2 converts astrocytes into neurons from intact mouse dorsal spinal cord in vivo.
a, b Double staining of mCherry and GFAP on transections of the dorsal spinal cord from WT mice infected with AAV-mCherry (a) or AAV-Neurog2/mCherry (b) at 3 DPI. Upper left, upper right, bottom left, and bottom right represent mCherry, GFAP, DAPI, and merged images, respectively. Arrows in merged images indicate mCherry+GFAP+ cells. Scale bar: 20 μm (a, b). c–d″″ Double staining of mCherry and NeuN on transections of the dorsal spinal cord from WT mice that were infected with the control virus AAV–mCherry (c–c″″) or AAV-Neurog2/mCherry (d–d″″) on day 3. e–f″″ Double staining of mCherry and NeuN on sections of the dorsal spinal cord from WT mice that were infected with the control virus AAV–mCherry (e–e″″) or AAV-Neurog2/mCherry (f-f″″) on day 30. Panels (c″″, d″″, e″″, f″″) are higher magnifications of the boxed areas in (c″′, d″′, e″′, f″′), respectively. mCherry was not colocalized with NeuN (arrowheads), mCherry colocalized with NeuN (arrows). Arrows and arrowheads in (c″″, d″″, e″″, f″″) represent mCherry+NeuN+ cells and mCherry+NeuN- cells, respectively. Scale bars: 50 μm (c″′, d″′, e″′, f″′) and 25 μm (c″″, d″″, e″″, f″″). g The statistical data of astrocyte-to-neuron conversion efficiency induced by Neurog2 at different time points. A one-way ANOVA revealed a significant effect of group, followed by Tukey’s multiple comparison test. ***Represents p < 0.001; h–h″″ 3D images of (f″″″): (h) front view of (f″″), (h′) left side of view of (h) rotated 30°, (h″) top view of (h) rotated 30°, (h″′) bottom view of (h), (h″″) right view of (h). The red arrows in (f″″, h, h′, h″, h″′, h″″) show a typical view of the same cell. i, j Immunostaining of Pax2 (i) and Tlx3 (j) on sections of spinal cord at 30 DPI.

