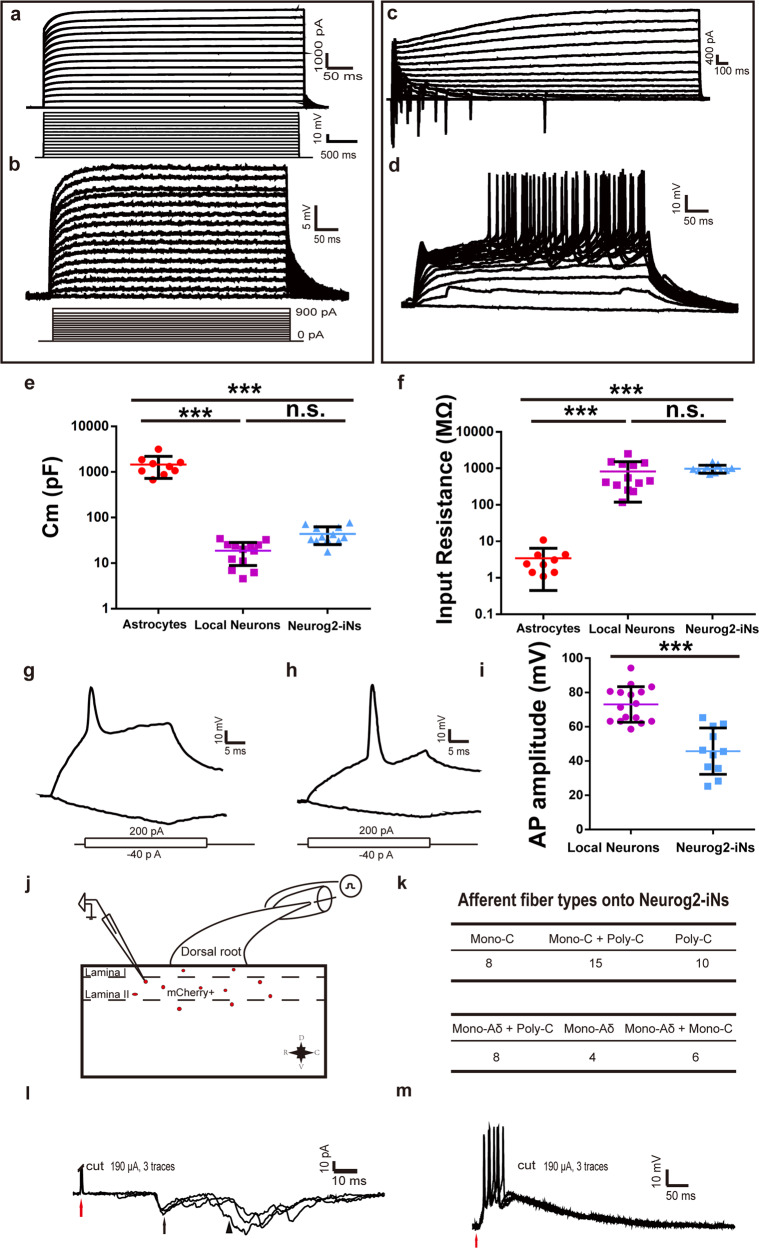
Fig. 5. Neurog2-iN cells exhibit mature electrophysiological properties and receive peripheral inputs from dorsal root ganglion.
a, b Membrane properties of an mCherry+ astrocyte recorded in an acute dorsal spinal cord slice prepared from a WT mouse infected with the control virus AAV–mCherry at 30 DPI. Membrane currents (a) and voltages (b) were recorded in voltage- and current-clamp modes, respectively, in responses to the step current or voltage commands. c, d Membrane functions of iN cells (mCherry+) in slices of the dorsal spinal cord that were prepared from WT mice infected with AAV–Neurog2/mCherry at 30 DPI. Membrane currents (c) and membrane voltages (d) were recorded in voltage- and current-clamp modes, respectively. e The comparison of membrane capacitance among AAV-mCherry-infected cells (red), local neurons (purple), and AAV-Neurog2/mCherry-infected cells (light blue). A one-way ANOVA revealed a significant effect of group (F[2,31] = 48.02, p < 0.001), followed by Tukey’s multiple comparison test. f The comparison of input resistance among AAV-mCherry-infected cells, local neurons and AAV-Neurog2/mCherry-infected cells. A one-way ANOVA revealed a significant effect of group (F[2,31] = 11.54, p < 0.001), followed by Tukey’s multiple comparison test. g, h Two kinds of representative traces of APs induced by depolarization currents of Neurog2-iN cells (mCherry+) in the slice of spinal cord. i The comparison of AP amplitude (mV) of recorded cells between local neurons and Neurog2-iN cells. Statistical analysis was performed using the two-tailed t-test method. j Schematic showing relative positions of recorded mCherry+ cells. D, V, R, and C in (j) represent dorsal, ventral, rostral, and caudal, respectively. k The table is a summary of inputs from DRG in 51 recorded mCherry+ cells from 5 mice. l Typical traces of C-fiber-evoked mono-C and poly-C EPSCs onto mCherry+ cells. m Typical traces of Aδ-fiber-evoked EPSPs and APs showing Aδ fiber inputs onto mCherry+ cells. *** Represents p < 0.001, n.s. denotes not significant.

