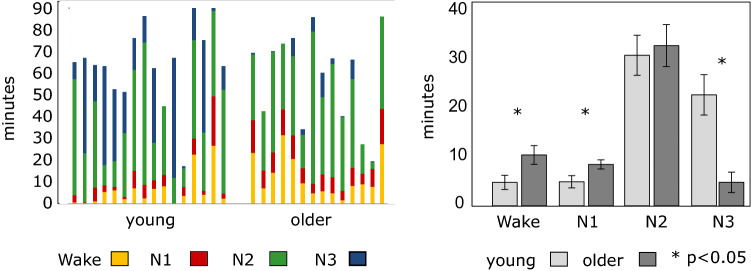
Figure 1.
Duration of wakefulness and sleep stages recorded in the scanner. Left panel represents individuals’ times in wakefulness and each sleep stage (duration in min). Right panel represents group values in wakefulness and each sleep stage. Young participants are presented in light grey, older participants in darker grey. Duration of wakefulness, N1, N2, and N3 (mean ± SEM) were recorded in the scanner (after exclusion of EEG epochs associated with high motion in the fMRI series; see “Materials and methods” section).

