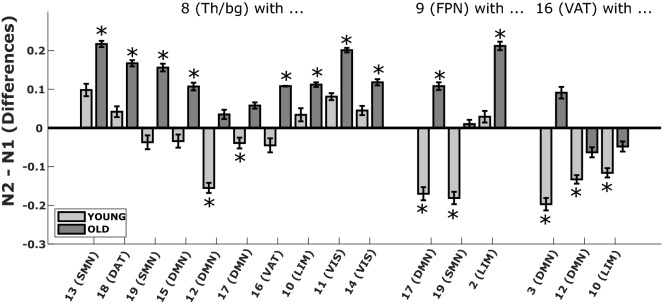
Figure 5.
Examples of functional connectivity differences in young and older individuals for N2 vs. N1. This graph is a sample of the connectivity values (R-value; Pearson correlation coefficient) associated with the N2 and N1 comparison between specific clusters and networks that behave differently in young (light grey) and in older individuals (darker grey). Asterisks indicate a significant decrease or increase in functional connectivity for young or/and older groups. Examples of the between-inter networks’ interactions are presented for the default-mode network (DMN), the sensorimotor network (SMN), the dorsal attentional network (DAT), the ventral attentional network (VAT), the frontoparietal network (FPN), the limbic network (LIM) and the visual network (VIS) and thalamus/basal ganglia (Th/bg) clusters (see Fig. 2 and this figure for more details on the subdivision of clusters and for an exhaustive description of functional connectivity differences).

