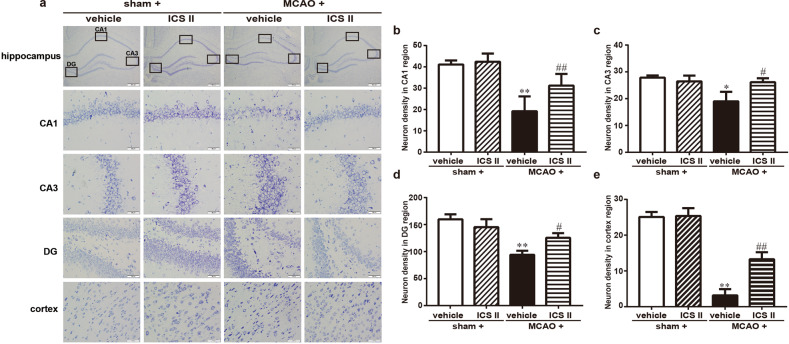
Fig. 3. ICS II protected against cerebral I/R injury-induced neuronal loss in the hippocampus and cortex.
a The hippocampal CA1, CA3, and DG regions and cortex. b Quantitative analysis of neuronal density in the CA1 region. c Quantitative analysis of neuronal density in the CA3 region. d Quantitative analysis of neuronal density in the DG region. e Quantitative analysis of neuronal density in the cortex. *P < 0.05, **P < 0.01 vs sham; #P < 0.05, ##P < 0.01 vs MCAO; n = 6 per group.

