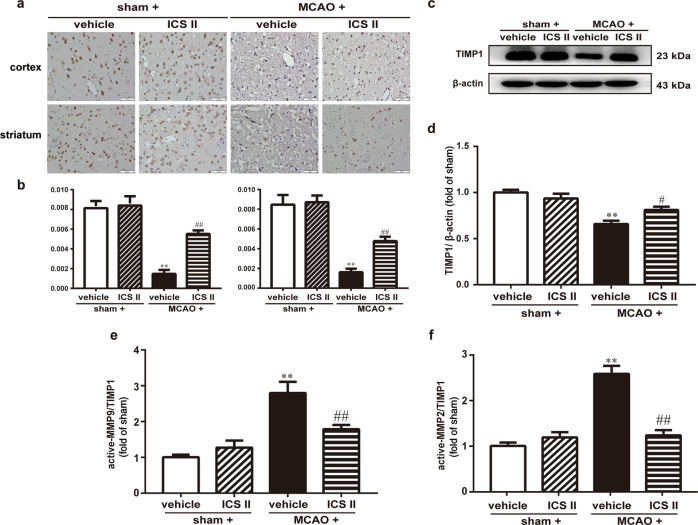
Fig. 5. ICS II increased TIMP1 expression in cerebral I/R-induced injury.
a Representative images of immunohistochemical staining of TIMP1 in the cortex and striatum. b Quantitative analysis of TIMP1 in the cortex and striatum. c Representative images of immunoblotting of TIMP1 in the penumbra. d Quantitative analysis of TIMP1 in the penumbra. e Quantitative analysis of active MMP9/TIMP1 in the penumbra. f Quantitative analysis of active MMP2/TIMP1 in the penumbra. Five random microscope fields per section were chosen. The average was calculated. **P < 0.01 vs sham; #P < 0.05, ##P < 0.01 vs MCAO; n = 6 per group.

