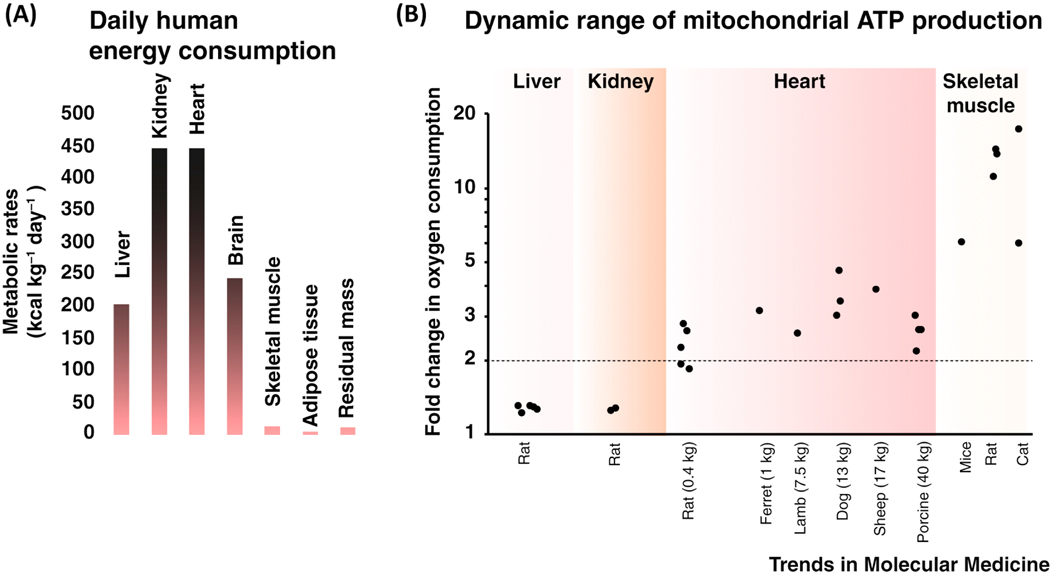
Figure 1. Energy consumption and its dynamic range in different tissues.
A. Daily metabolic rates of major organs and tissues. Shown values are from human subjects. Data is from Wang et al., 2010 [215]. B. Fold changes in oxygen consumption rates of different tissues in different species. Each data point shows the fold change in oxygen consumption determined by distinct studies performed in liver [15–20], kidney [21, 22], heart [23–32], and skeletal muscle [33–36]. All shown measurements were carried out with healthy tissues of wild-type animals under similar, physiologically relevant basal and strenuous activities. The indicated weight (in Kg) is the total body weight.

