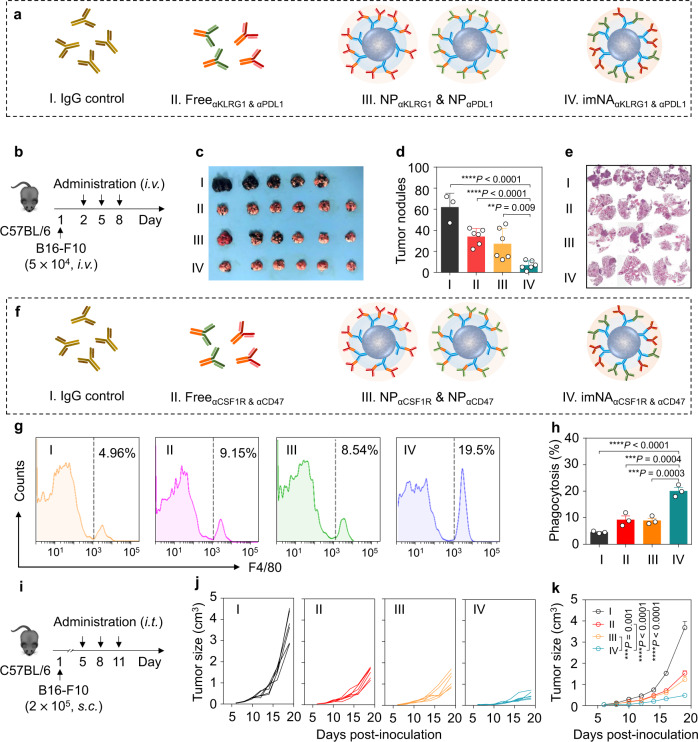
Fig. 5. αFc-NP serves as a versatile antibody immobilization platform and imNAs enhance the anti-tumor effect of multiple immunomodulatory mAbs.
a imNA was constructed to enhance the antitumor activity of NK cells, and the following four groups were established: (1) IgG control; (2) FreeαKLRG1 & αPDL1; (3) NPαKLRG1 & NPαPDL1; and (4) imNAαKLRG1 & αPDL1. b Experimental protocol for the lung metastatic melanoma tumor model used in c–e: C57BL/6 mice were injected with 5.0 × 10⁴ B16-F10 melanoma cells via the tail vein, and treatment started on the second day. The equivalent dose of αKLRG1 and αPDL1 was 1.5 mg/kg. c Images of lung tissues at 20 days post tumor cell infusion. d Calculation of tumor nodules on the lung tissues. Data are presented as means ± s.d. n = 3 or 6 biologically independent mice, each pot represents one mouse. e Representative H&E images of lung tissues. f imNA was constructed to enhance the antitumor activity of macrophages, and the following four groups were established: (1) IgG control; (2) FreeαCSF1R & αCD47; (3) NPαCSF1R & NPαCD47; and (4) imNAαCSF1R & αCD47. Representative flow cytometric analysis images (g) and relative quantification (h) of the phagocytosis of cancer cells by bone marrow-derived macrophages (BMDMs). CFSE-labeled B16-F10 cells were incubated with BMDMs for 4 h in the presence of IgG control, FreeαCSF1R & αCD47, NPαCSF1R & NPαCD47 or imNAαCSF1R & αCD47, and then subjected to flow cytometric detection. Phagocytosis was quantified as the percentage of CFSE-positive BMDMs. Data are presented as means ± s.d. n = 3 biologically independent samples. i Experimental protocol for the B16-F10 melanoma model used in j, k, the equivalent dose of αCSF1R and αCD47 was 1.5 mg/kg, and the dose of IgG control was 3.0 mg/kg. Individual (j) and average (k) tumor growth curves of B16-F10 tumors in mice receiving different treatments. Data are presented as means ± s.d. n = 6 biologically independent mice. Statistical significance was calculated via one-way ANOVA with the Tukey post-hoc test. **P < 0.01; ***P < 0.001; ****P < 0.0001. Source data are provided as a Source Data file.

