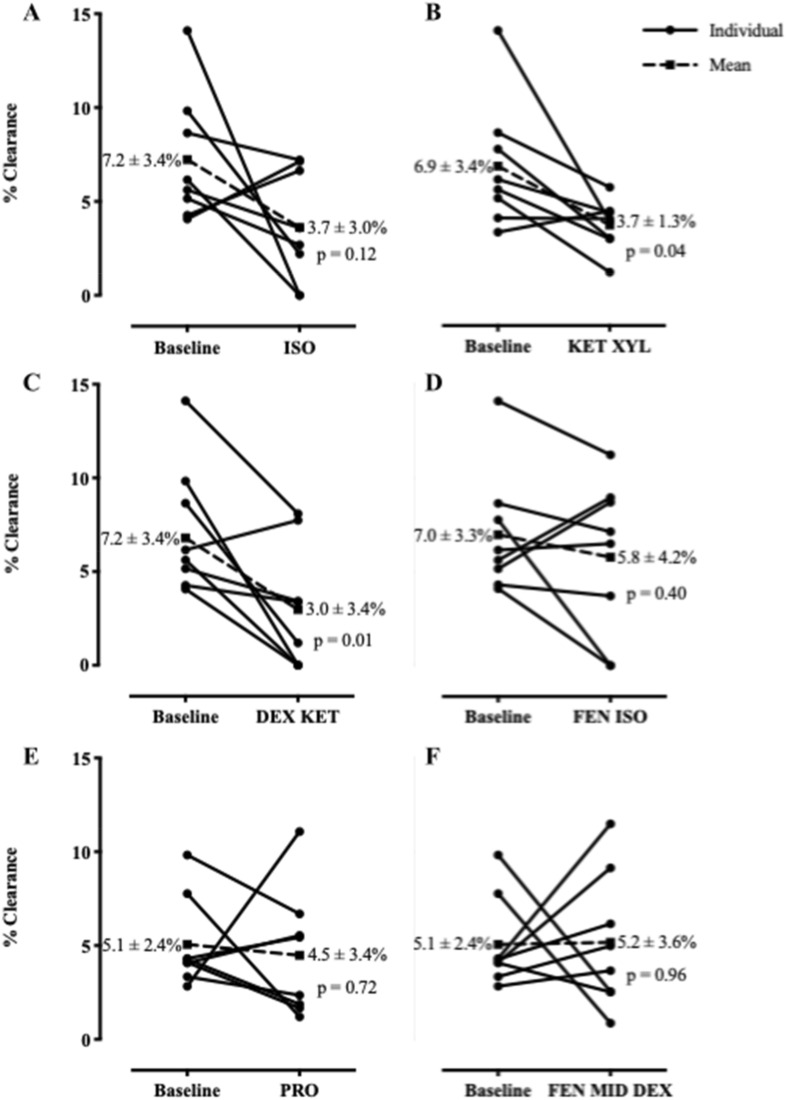
Figure 5.
Measured MCC for each anesthetic. Individual clearances for each mouse are graphed in before-after line graphs. Each graph shows the baseline clearance and the clearances after anesthetic treatment. Mean clearances ± SD, and respective paired t-test p-values are graphed comparing each anesthetic to the baseline. (A) Isoflurane. (B) Ketamine and xylazine. (C) Dexmedetomidine and ketamine. (D) Fentanyl and isoflurane. (E) Propofol. (F) Fentanyl, midazolam, and dexmedetomidine.

