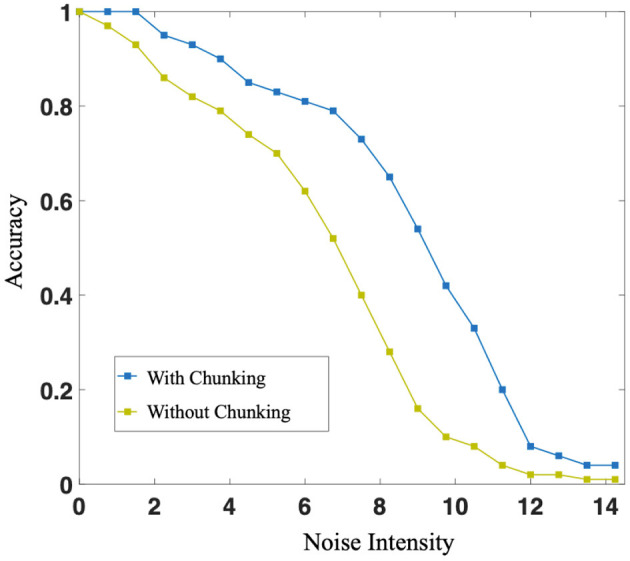
Figure 9.

The blue curve and the green curve represent the production accuracy of neural network with or without chunking strategy, respectively. With the increase of noise intensity, both accuracy decreases. However, the accuracy of networks with chunking strategy is always higher than that without chunking strategy.
