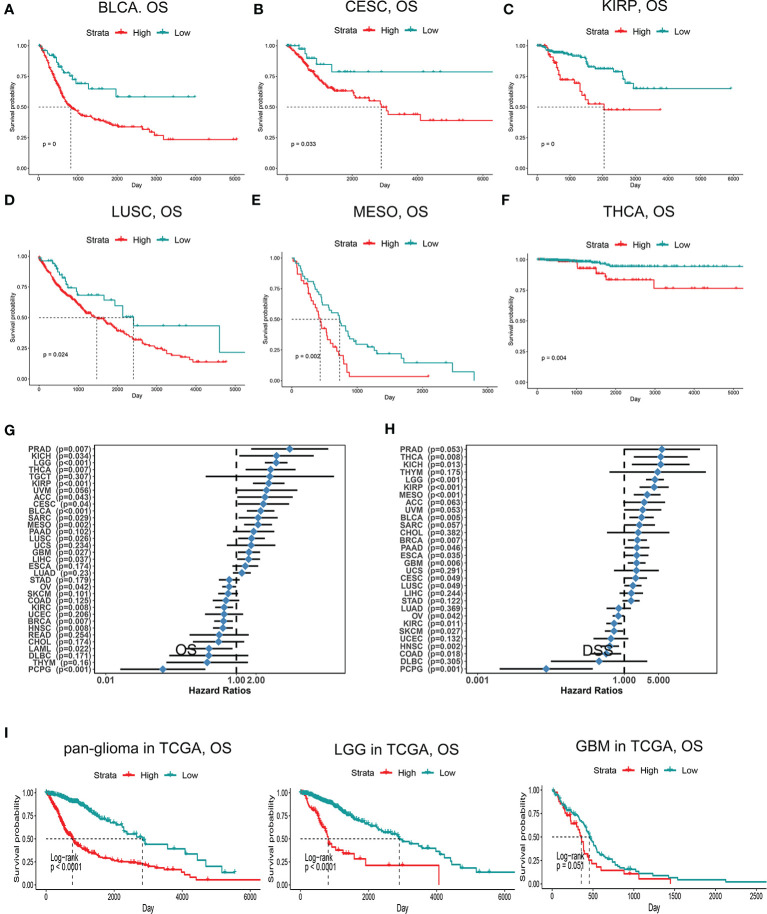
Figure 2.
Kaplan-Meier survival curves comparing high and low expression of PDIA5 in different cancers. OS of bladder urothelial carcinoma (BLCA) (A), cervical and endocervical cancers (CESC) (B), kidney renal papillary cell carcinoma (KIRP) (C), lung squamous cell carcinoma (LUSC) (D), mesothelioma (MESO) (E), and thyroid carcinoma (THCA) (F). Correlation of PDIA5 expression with OS (G) and DSS (H) in 33 types of cancer. OS, overall survival. DSS; disease specific survival. (I) Kaplan-Meier analysis of OS based on high vs. low expression of PDIA5 in pan-glioma, LGG, and GBM patients in the TCGA dataset. Red curve represents patients with high expression of PDIA5, and blue curve represents low PDIA5.

