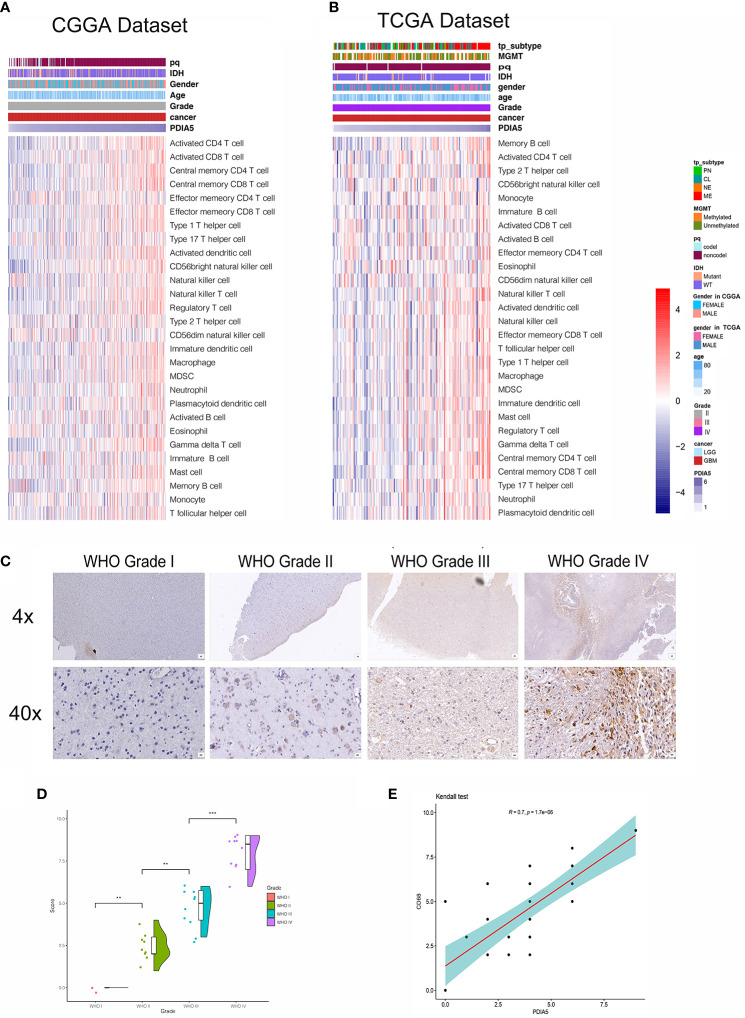
Figure 4.
Correlation between PDIA5 expression and immune cell infiltration in gliomas. Correlation of PDIA5 and 28-immune cell lineage genes in glioblastoma multiforme (GBM) from the Chinese Glioma Genome Atlas (CGGA) (A) and The Cancer Genome Atlas (TCGA) (B) datasets. Expression values are z-transformed and are highlighted in red for high expression and blue for low expression as indicated in the scale bar. (C) Representative images of immunohistochemical (IHC) staining for CD68 in different WHO grades of gliomas [scale bar=625µm (upper), 50µm (lower)]. (D) Quantification (H-score) of CD68 IHC staining in normal brain (n=3) and different pathological grades of gliomas (n=31). (E) Correlations analysis between PDIA5 and CD68 of IHC staining. **P <.01, ***P <.001.

