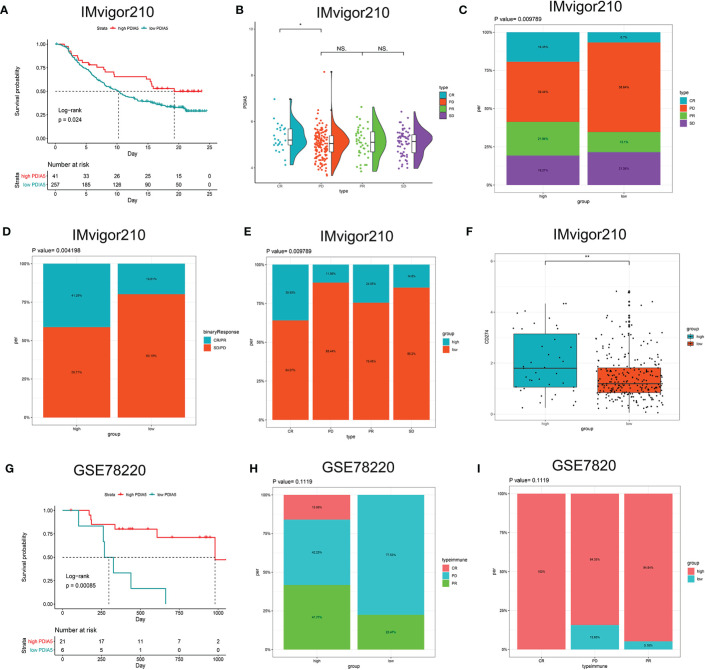
Figure 8.
The role of PDIA5 in predicting the therapeutic value of checkpoint blockade immunotherapy. (A) Kaplan–Meier survival plot showed a significant survival benefit in the high PDIA5 group of IMvigor210 cohort. (B) Distribution of PDIA5 in the distinct anti-PD-L1 clinical response group. *p <.05, ns, p >.05. (C) The proportions of clinical response to anti-PD-L1 immunotherapy in the high and low PDIA5 groups. (D) The proportions of clinical binary response to anti-PD-L1 immunotherapy in the high and low PDIA5 groups. (E) The proportions of the high and low PDIA5 groups in the anti-PD-L1 immunotherapy clinical response. (F) Differences in CD274 (PD-L1) expression in the high and low PDIA5 groups in the IMvigor210 cohort. (G) Kaplan–Meier survival plot showed a significant survival benefit in the high PDIA5 group of GSE78220 cohort. (H) The proportions of clinical response to anti-PD-1 immunotherapy in the high and low PDIA5 groups. (I) The proportions of the high and low PDIA5 groups in the anti-PD-1 immunotherapy clinical response. **p < .01.

