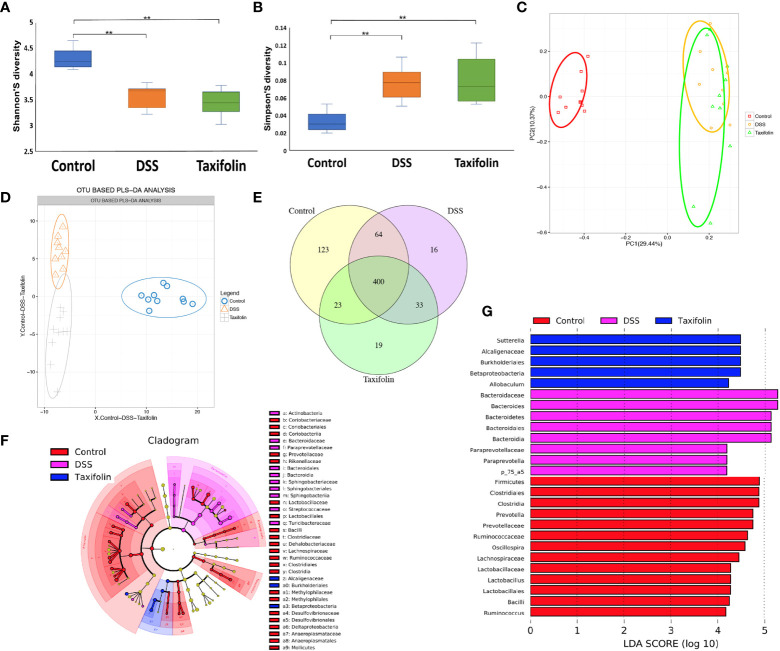
Figure 5.
Taxifolin altered the composition of the colon microbiota in colitis mice. (A, B) Alpha diversity was estimated by the Shannon and Simpson indexes; (C, D) Principal component analysis (PCA) plot and partial least squares discriminant analysis (PLS-DA) of gut microbiota; (E) Venn diagram of OTUs; (F) Taxonomic cladogram of LEfSe analysis. Different colors indicate the enrichment of the biomarker taxa in the control (red), DSS (pink), and taxifolin (purple) group. The circle from inside to outside means the rank from kingdom to species, and the circle size represents the taxa abundance in the community. (G) Linear discriminant analysis (LDA) score for different taxa abundances. Data were expressed as means ± SEM (n = 10).**P < 0.01.

