FIGURE 1.
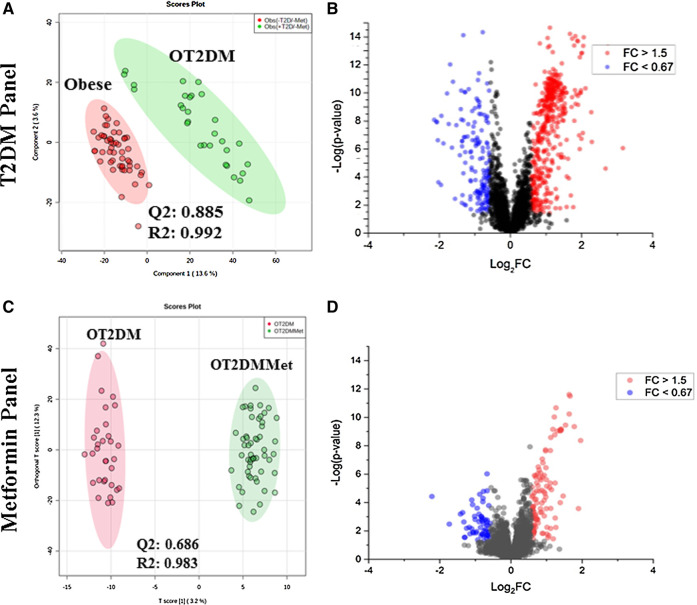
Metabolomics profile of the study population (A) Obese vs. obese diabetic patients (OT2DM) metabolomics profile was evaluated using PLS-DA analysis, the clusters of both groups were clearly separated (Q2 = 0.885, R = 0.992) (B) Volcano plot of obese vs. OT2DM groups shows the significantly changed metabolites. 459 metabolities were up-regulated and 166 were down-regulated in OT2DM group with fold change and FDR adjusted p-value at the cut-off 1.5 (or 0.67), and (0.038, respectively (C) Obese diabetic (OT2DM) vs. Obese diabetic taking metformin (OT2DMMet) metabolomic profile was evaluated using PLS-DA analysis, the clusters of both groups were clearly separated (Q2 = 0.686, R2 = 0.983) (D) Volcano plot of OT2DM vs. OT2DMMet group shows levels of 107 metabolites were significantly different as of metformin, 78 were upregulated and 29 were down-regulated in obese diabetic patients taking metformin. The fold change and FDR adjusted p-value at the cut-off 1.5 (or 0.67) and 0.05, respectively.

