FIGURE 4.
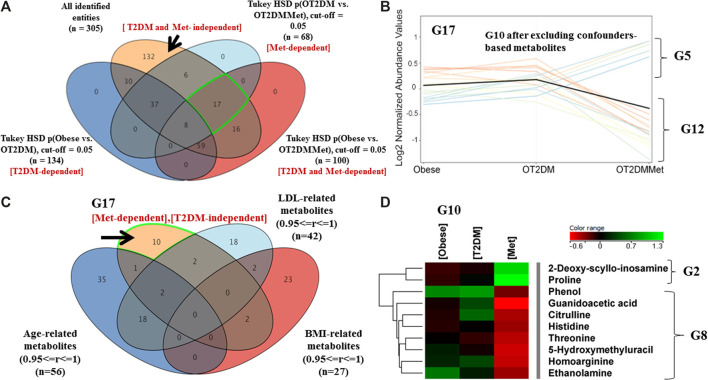
Metabolic pattern of metformin administration effect on metabolites that are not changed with T2DM in obesity (A) Venn diagram illustrates the extraction of 17 metabolite that were non-significant as of T2DM (T2DM-independent), as well as 132 metabolites that are irrespective neither to T2DM nor to metformin administration (T2DM and Met-independent) (B) Five metabolites (G5) wereup regulated, and 12 (G12) were down regulated as of metformin administration only and their levels were unchanged as of T2DM (FC cutoff is 1.5) (C) Venn diagram demonstrates the exclusion of the confounders-based metabolites from G17 (D) Heat map for the metabolites that were either upregulated (G2) or down regulated (G8) after excluding the confounder-based metabolites as of metformin administration in obese diabetic patients.

