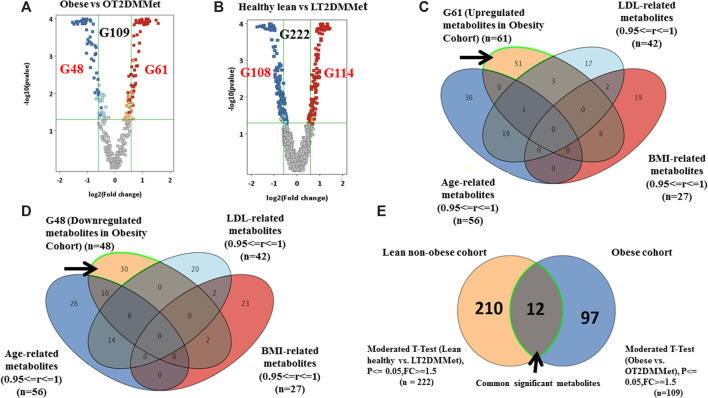
FIGURE 5.
Significant metabolites that are common between obese and lean cohorts (A) Volcano plot pf obese vs. OT2DMMet groups from the obese cohort shows the significantly changed metabolites. A total of 109 metabolites (G109) were significant, (G61) down-regulated after metformin administration in obese diabetic patients compared to obese non-diabetic participants, the fold change and FDR-adjusted p-value at the cutoffs were 1.5 and <0.05, respectively (B) Volcano plot of lean healthy vs. LT2DMMet groups from the lean cohort shows that a total of 222 metabolites (G222) were significant between compared groups, where (G114) were up regulated and (G108) were down regulated after metformin administration in lean non-obese diabetic patients compared to healthy lean, with fold change and FDR adjusted p-value at the cut-off 1.5 and 0.05, respectively, (C, D) Venn diagrams demonstrate the exclusion of the confounders-based metabolites from G61 and G48, where the metabolites were reduced to G51 and G30, respectively (E) Venn diagram shows that 12 metabolites are common between obese and lean non-obese cohort using moderate t-Test.

