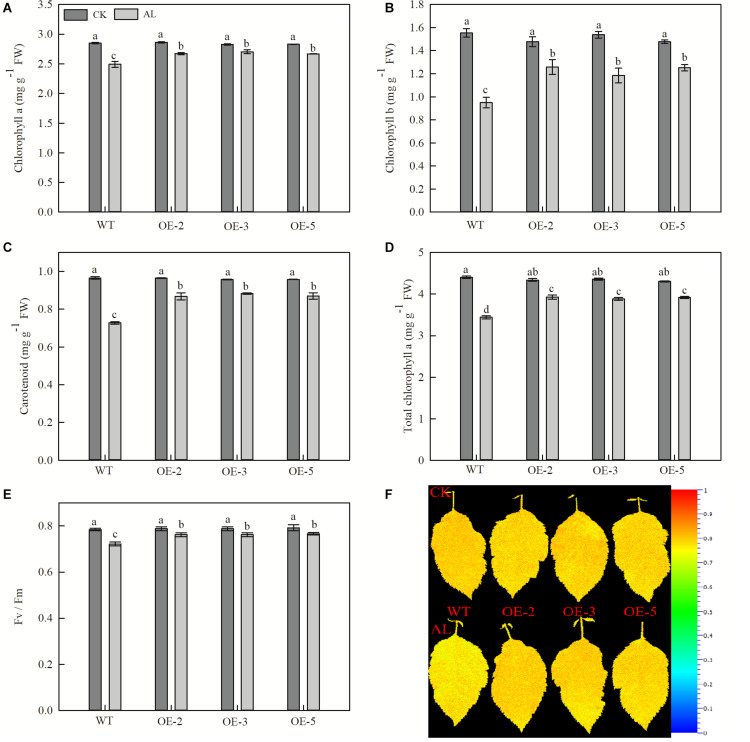
FIGURE 4.
Overexpression of MdTyDc enhanced the chlorophyll concentrations and Fv/Fm after 15 days under control and alkaline conditions. (A) Chlorophyll a, (B) chlorophyll b, (C) carotenoids, (D) total chlorophyll, (E) Fv/Fm, and (F) Fv/Fm image obtained from chlorophyll fluorescence imaging. The data are presented as means ± SD (n = 5). Significant differences between WT and MdTyDc overexpression lines are indicated by different lowercase letters based on Tukey’s multi-range test (P < 0.05). WT, wild type. OE-2, MdTyDc overexpression line 2. OE-3, MdTyDc overexpression line 3. OE-5, MdTyDc overexpression line 5.

