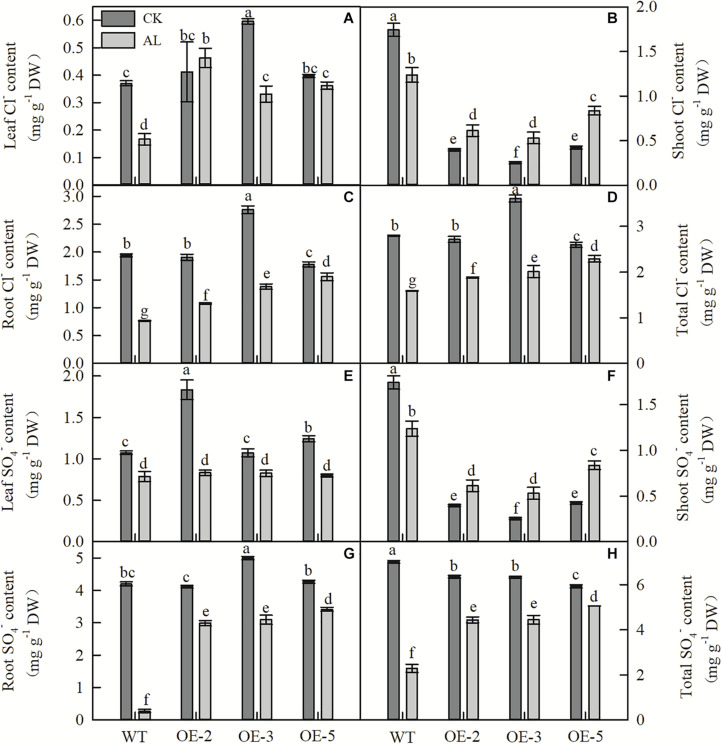
FIGURE 6.
MdTyDc overexpression changed the Cl–and SO42– content in apple plants after 15 days under control and alkaline conditions. (A) Leaf Cl– content, (B) shoot Cl– content, (C) root Cl– content, (D) total Cl– content, (E) leaf SO42– content, (F) shoot SO42– content, (G) root SO42– content, and (H) total SO42– content. The data are presented as means ± SD (n = 3). Significant differences between WT and MdTyDc overexpression lines are indicated by different lowercase letters based on Tukey’s multi-range test (P < 0.05). WT, wild type. OE-2, MdTyDc overexpression line 2. OE-3, MdTyDc overexpression line 3. OE-5, MdTyDc overexpression line 5.

