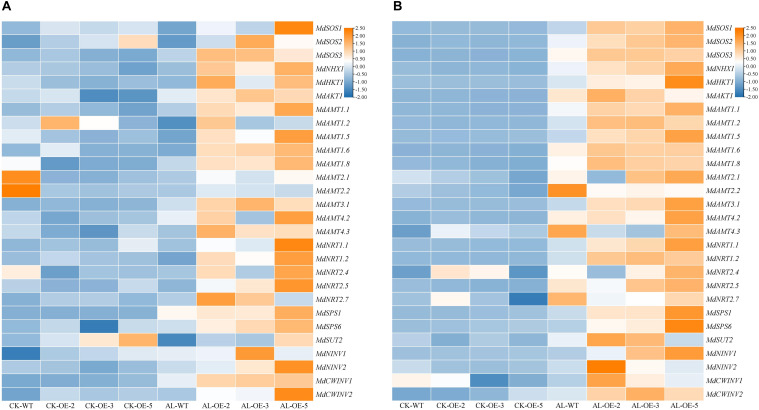
FIGURE 8.
Heatmap presenting expression levels of 6 ion-transport-related genes (MdSOS1, MdSOS2, MdSOS3, MdNHX1, MdHKT1, and MdAKT1), 15 N-absorption-related genes (MdAMT1.1, MdAMT1.2, MdAMT1.5, MdAMT1.6, MdAMT1.8, MdAMT2.1, MdAMT2.2, MdAMT3.1, MdAMT4.2, MdAMT4.3, MdNRT1.1, MdNRT1.2, MdNRT2.4, MdNRT2.5, and MdNRT2.7) and 7 C-metabolism-related genes (MdSPS1, MdSPS6, MdSUT2, MdNINV1, MdNINV2, MdCWINV1 and MdCWINV2) in (A) leaves and (B) roots of MdTyDc-overexpressing apple plants after 15 days under control and alkaline conditions. The data are presented as means ± SD (n = 3). Significant differences between WT and MdTyDc overexpression lines are indicated by different lowercase letters based on Tukey’s multi-range test (P < 0.05). WT, wild type. OE-2, MdTyDc overexpression line 2. OE-3, MdTyDc overexpression line 3. OE-5, MdTyDc overexpression line 5.

