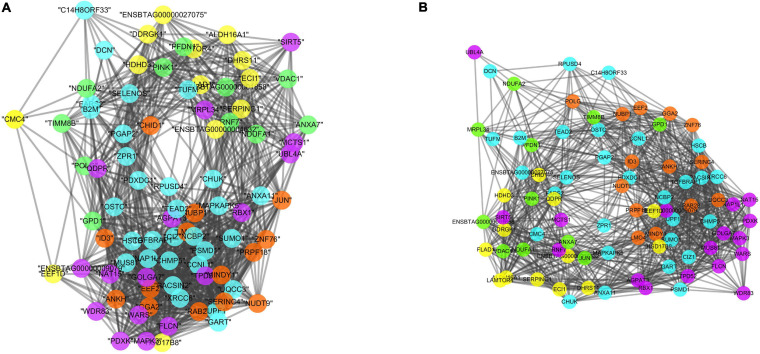
FIGURE 3.
Co-expression networks in LFE (A) and HFE (B), colors are relative to the tissue of maximum expression: yellow represents liver, green represents muscle, orange represents pituitary, purple represents hypothalamus, and blue represents adrenal gland. The results are based on the genes selected by the RX.

