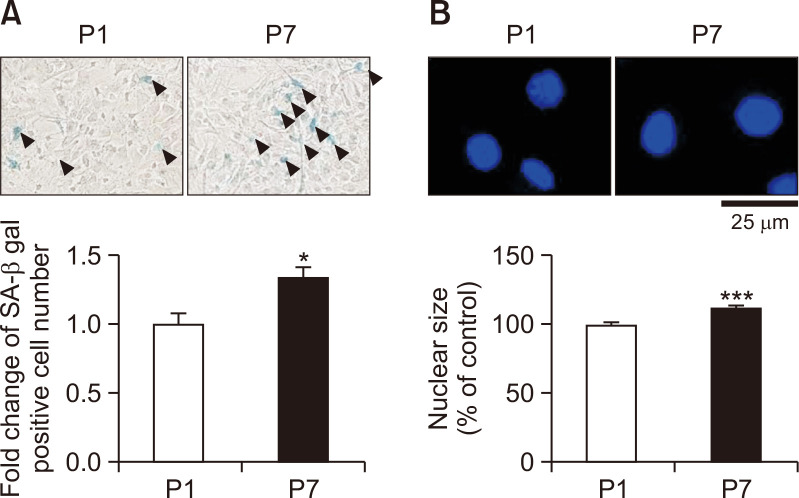
Fig. 1.
Late passage astrocytes induced SA-β-gal positive cell number and nuclear size. Astrocytes were sub-cultured either once (passage 1; P1) or 7 times (passage 7; P7). (A) Astrocytes were measured by the SA-β-gal staining. Stained astrocytes were indicated by black triangles as SA-β-gal-positive cells. The graph represents the fold change of SA-β-gal-positive cell number in astrocytes. (B) Astrocytes were stained to determine the nuclear size. The graph shows the nuclear size of P7 compared to P1. The bars indicate the mean ± SEM (n=3). *indicates p<0.05 and, ***indicates p<0.001 vs. P1 astrocytes.

