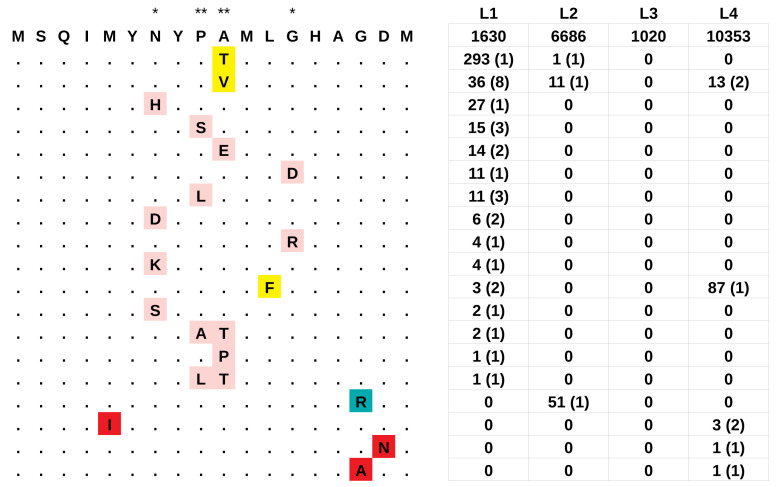
Figure 3. The hypervariable epitope at the N terminus of esxH (aa 1–18).
The ancestral epitope is reported in top position, the derived haplotypes are reported below: mutations that were present in more than one lineage are highlighted in yellow, haplotypes that were found exclusively in L1, L2 or L4 are highlighted in pink, blue and red, respectively. Asterisks indicate the position inferred to be under positive selection by PAML: * posterior probability > 0.95: ** posterior probability > 0.99. The table on the right reports for each lineage the number of strains harboring the corresponding haplotype, and between parentheses, the number of independent parallel occurrences of the mutations as inferred by PAUP.

