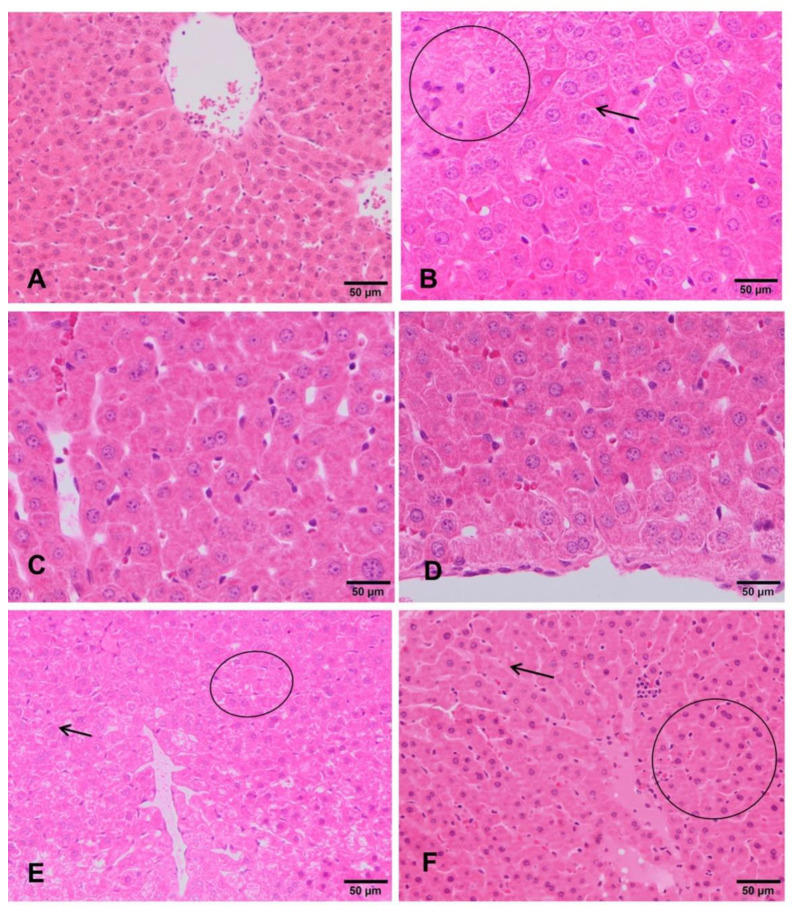
Figure 3.
Histopathological changes in the liver of rats exposed to ST-99. Normal hepatic parenchyma is observed in negative control group (A). Detail of hepatic cordons of rat exposed to the positive control (B), showing glycogenic degeneration (arrow) and abundant polyploid hepatocytes (circle). Rats exposed to 90 and 180mg/kg ST-99 showed an apparently normal liver parenchyma (C,D). Rats exposed to 360 mg/kg ST-99 exhibited slight presence hepatic apoptosis throughout the lobule (circle) and glycogenic degeneration (arrow) (E,F).

