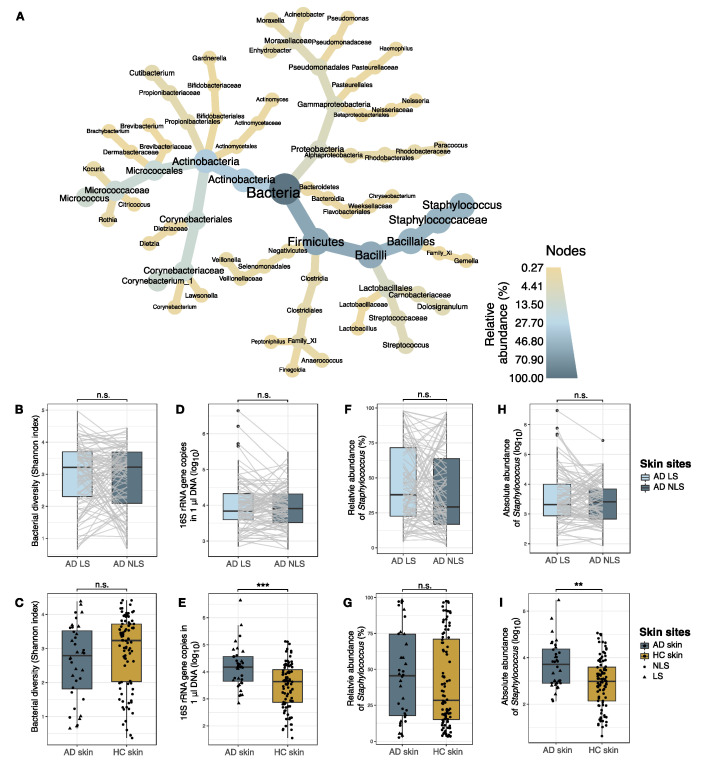
Figure 2.
Skin bacterial communities. (A) Taxonomic illustration of the 30 most abundant genera on AD skin. Color and size of nodes and leaves correspond to the average relative abundance of taxa. AD lesional and non-lesional skin samples were grouped together. (B,C). Bacterial alpha diversity measured by Shannon index. (D,E) Absolute abundance of bacteria, measured as 16S rRNA gene copies within 1 µl DNA sample eluate. (F,G) Relative abundance (%) of Staphylococcus genus. Differences between skin sites were tested using ANCOM-BC modelling on log transformed sequence counts. (H,I) Absolute abundance of Staphylococcus, calculated by combining 16S rRNA qPCR and amplicon sequence data. In B, D, F, and H, lesional and non-lesional skin of AD patients (n = 94) were compared. Samples collected from the same patient are indicated by grey lines. In C, E, G, and I, skin samples collected from AD patients (n = 36) and healthy individuals (n = 92) were compared. Here, AD lesional (triangles) and non-lesional (dots) skin samples were grouped together as AD skin. Boxplots represent the median and interquartile range (IQR) with whiskers extending to the minimum/maximum value, but no longer than 1.5xIQR. Asterisks indicate statistical significance: ** p < 0.01, *** p < 0.001, n.s.: not significant. Abbreviations: AD: atopic dermatitis; LS: lesional skin; NLS: non-lesional skin; HC: healthy control skin.

