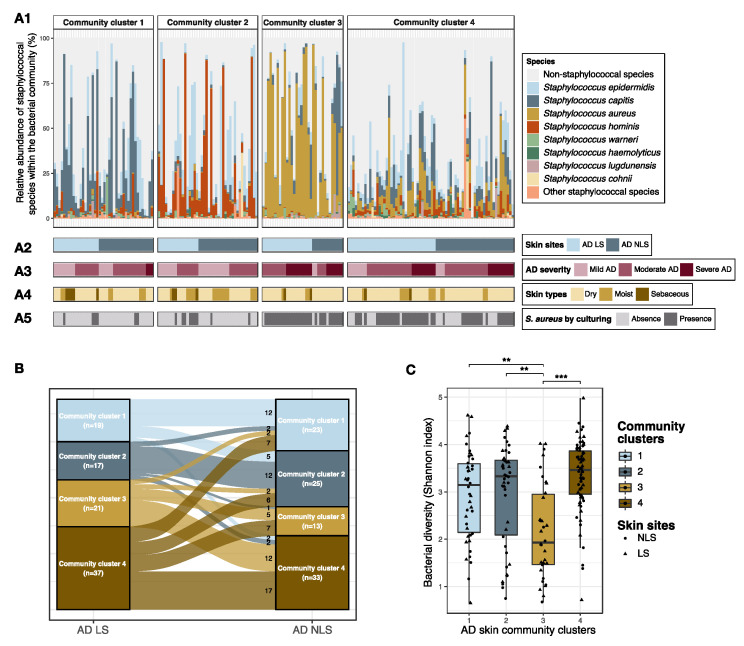
Figure 3.
Staphylococcal communities on AD skin. Lesional and non-lesional skin from AD patients (n = 94) were grouped into four distinct community clusters based on compositional similarities of staphylococcal species. (A1) Bar plot showing the relative abundances of the eight most abundant staphylococcal species within the bacterial community. (A2) Tile plot showing whether samples were collected from lesional or non-lesional skin. (A3) Tile plot showing the AD severity of patients from whom the samples were collected. Mild AD: SCORAD < 25; Moderate AD: SCORAD 25–50; and Severe AD: SCORAD > 50. (A4) Tile plot showing whether samples were collected from dry, moist, or sebaceous skin areas. (A5) Tile plot showing S. aureus colonization status, defined by culturing. (B) Sankey diagram for intra-individual comparison of staphylococcal community cluster assignment of lesional and non-lesional skin. (C) Comparison of skin bacterial alpha diversity, measured by Shannon index, across the four defined staphylococcal community clusters. Lesional and non-lesional skin samples were visualized as triangles and dots, respectively, and boxplots represent the median and interquartile range (IQR) with whiskers extending to the minimum/maximum value, but no longer than 1.5 × IQR. Asterisks indicate statistical significance: ** adj. p < 0.01, *** adj. p < 0.001. Abbreviations: AD: atopic dermatitis; LS: lesional skin; NLS: non-lesional skin.

