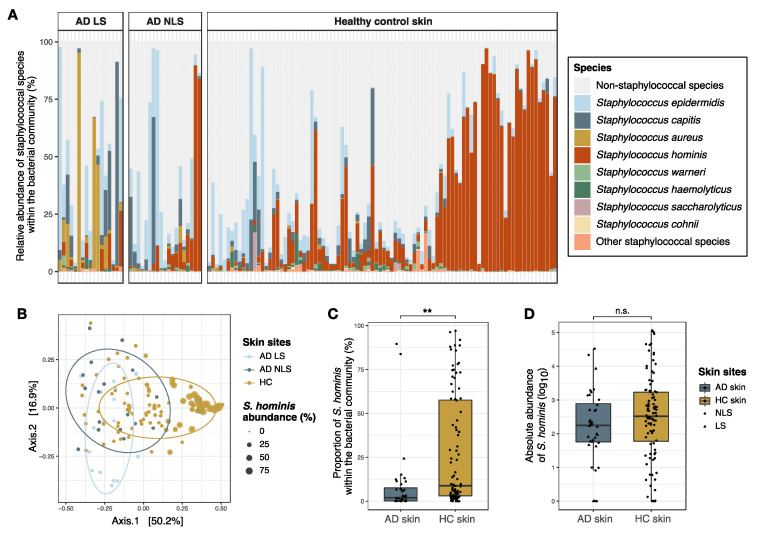
Figure 6.
Staphylococcal communities on the antecubital crease of AD patients and healthy individuals. (A) Bar plot showing the relative abundances of the eight most abundant staphylococcal species within the bacterial community of AD lesional skin (n = 17), AD non-lesional skin (n = 19), and healthy control skin (n = 92). (B) PCoA plot showing the compositional differences in staphylococcal communities on AD skin and healthy control skin. Point sizes are scaled based on the relative abundance of S. hominis within the bacterial community. Of note, two AD non-lesional skin samples with high S. hominis abundance cluster together with healthy control skin on the right side of the plot. (C) The relative abundance of S. hominis within the cutaneous bacterial community. (D) The absolute abundance of S. hominis on skin, which was calculated by combining proportional amplicon sequence data with 16S rRNA qPCR data. Thus, the absolute abundance is equivalent to the number of S. hominis 16S rRNA gene copies within 1µl DNA eluate (log10 transformed counts). Box plots represent the median and interquartile range (IQR) with whiskers extending to the minimum/maximum value, but no longer than 1.5 × IQR, and lesional and non-lesional skin samples are visualized as triangles and dots, respectively. Asterisks indicate a significant difference: ** p < 0.01, n.s.: not significant. Abbreviations: AD: atopic dermatitis; LS; lesional skin; NLS: non-lesional skin; HC skin: healthy control skin.

