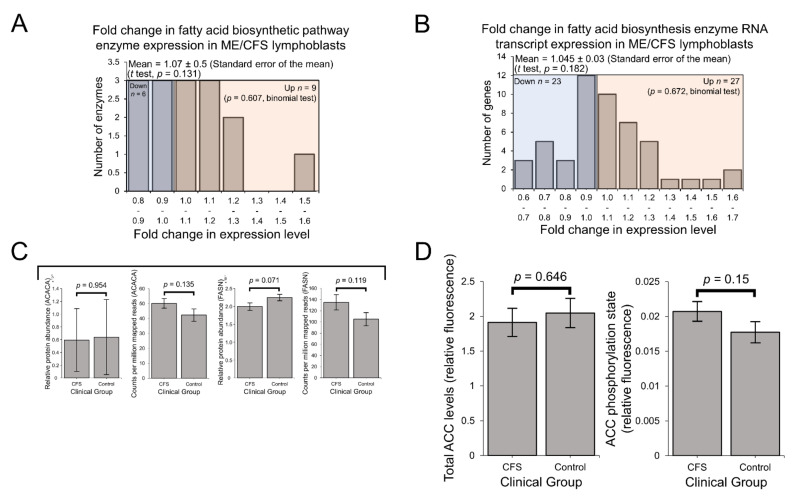
Figure 6.
Expression of enzymes involved in mitochondrial fatty acid biosynthesis was elevated in the whole-cell transcriptomes but unchanged in the whole-cell proteomes of ME/CFS lymphoblasts. AMPK activity is not significantly elevated in ME/CFS lymphoblasts. Error bars represent the standard error of the mean. RNA sequencing transcriptomics experiment: ME/CFS n = 23, control n = 17. Each cell line was sampled once. Mass spectrometry proteomics experiment: ME/CFS n = 34, control n = 31. Each cell line was sampled once, or twice for a subset of healthy controls arbitrarily selected to act an internal control between experiments in the proteomics work. (A) A total of 15 proteins involved in fatty acid biosynthesis were detected within the whole-cell proteomes of ME/CFS and control lymphoblasts. Fold change refers to the mean abundance of a given protein in the CFS group divided by the mean abundance in the control group. The proportion of detected proteins that were differentially expressed (binomial test with Ho set to 0.5) and the average extent of any differences (single-sample t test with Ho m = 1) were not statistically significant. (B) A total of 51 RNA transcripts encoding proteins involved in fatty acid biosynthesis were detected by RNA sequencing within the whole-cell transcriptomes of ME/CFS and control lymphoblasts. Mean fold change was calculated for the ME/CFS group versus the control average for each transcript. The proportions of reduced or elevated transcripts were not significantly different (binomial test with Ho set to 0.5) nor was the average magnitude of expression (single-sample t test with Ho m = 1). (C) The expression of ACACA and FASN, two key enzymes involved in fatty acid biosynthesis, was not significantly altered in whole-cell proteomics or transcriptomics experiments (independent t test). Relative abundance was obtained from Intensity-Based Absolute Quantitation values normalised to the control average within the respective individual experiments. per million mapped reads were calculated for each gene transcript (D) AMPK activity is not significantly elevated in ME/CFS lymphoblasts. Total ACC levels were unaltered. AMPK activity was determined by measuring the ACC phosphorylation state normalised to total ACC levels in ME/CFS lymphoblasts (n = 28) and healthy controls (n = 24). Each cell line was measured in at least three independent experiments. Fluorescence is expressed in relative terms as each experiment is normalised to an internal control cell line.

