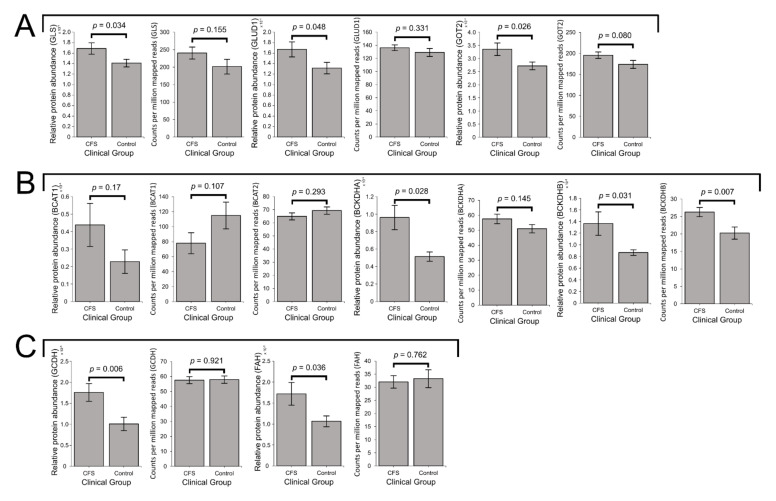
Figure 7.
Expression of proteins involved in mitochondrial glutamine, BCAA, lysine, tryptophan and phenylalanine utilisation are elevated in ME/CFS lymphoblasts. Error bars represent the standard error of the mean. RNA sequencing transcriptomics experiment: ME/CFS n = 23, control n = 17. Each cell line was sampled once. Mass spectrometry proteomics experiment: ME/CFS n = 34, control n = 31. Each cell line was sampled once, or twice for a subset of healthy controls arbitrarily selected to act an internal control between experiments in the mass spectrometry proteomics work. (A) Expression of the three enzymes mediating mitochondrial utilisation of glutamate (GLS, GLUD1 and GOT2) were elevated in the whole-cell proteomes and proteomes of ME/CFS lymphoblasts and control lymphoblasts (t test, p < 0.05 in all three cases), while each trended upwards but were not significantly elevated at the transcript level. Relative protein abundance was obtained from Intensity-Based Absolute Quantitation values normalised to the control average within the respective individual experiments. Counts per million mapped reads were calculated for each gene transcript. (B) In ME/CFS lymphoblasts, the expression of BCAT1 is unchanged at the protein and transcript levels, while BCAT2 was unchanged transcriptionally and not detected at the protein level. The levels of BCKDH subunits BCKDHA and BCKDHB are both significantly elevated at the transcriptional and protein levels (t test, p < 0.05), with the exception of BCKDHA transcripts. Relative protein abundance was obtained from Intensity-Based Absolute Quantitation values normalised to the control average within the respective individual experiments. Counts per million mapped reads were calculated for each gene transcript (C) The expression levels of GCDH and FAH were unchanged at the transcriptional level but elevated at the protein level (t test, p < 0.05) in ME/CFS lymphoblasts. Relative protein abundance was obtained from Intensity-Based Absolute Quantitation values normalised to the control average within the respective individual proteomics experiments. Counts per million mapped reads were calculated for each gene transcript.

