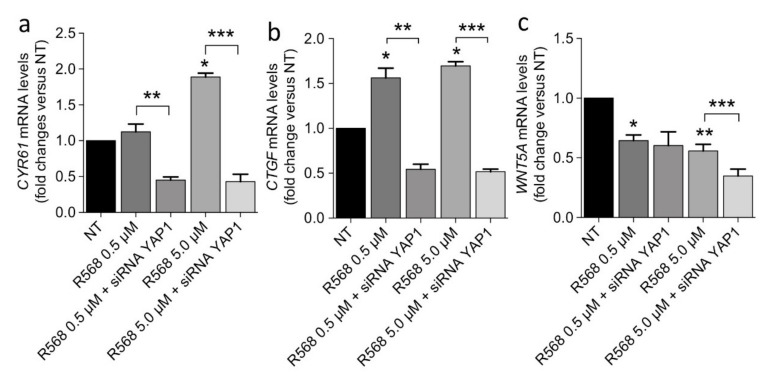
Figure 7.
CASR-YAP1 signaling modulation in the CASR-HEK293A cell model. CASR-HEK293A cultures were transiently silenced with a YAP1- or a mock-siRNA and then treated with R568. Gene expression of the indicated transcripts was analyzed by qPCR. p-values are from one-way ANOVA and are as follows: CYR61 (panel a): * p = 0.001 vs. NT; ** p = 0.012; *** p = 0.0001; CTGF (panel b): * p = 0.001 vs. NT; ** p = 0.031; *** p = 0.0001; WNT5A (panel c): * p = 0.015; ** p = 0.0002 vs. NT; ***, p= 0.01. Gene expression levels are presented as fold change with respect untreated conditions; data are mean ± SEM (n = 4).

