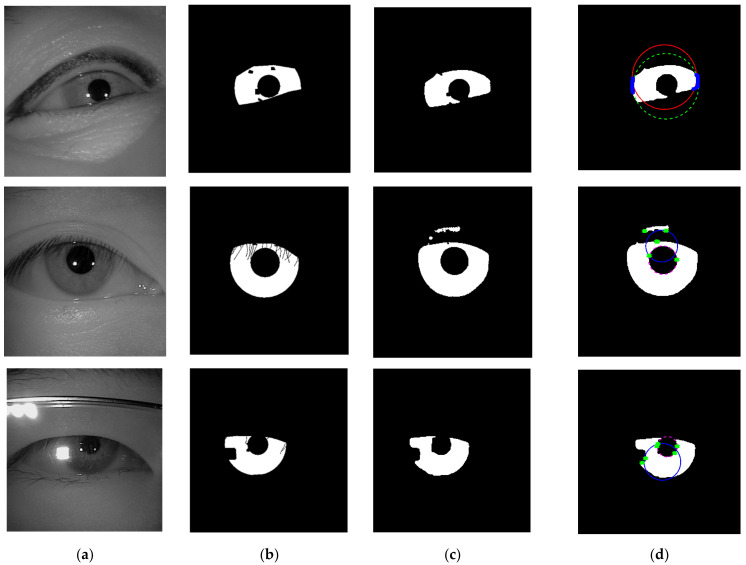
Figure 15.
Failure cases because of the strong occlusion. (a) Input images; (b) ground-truth masks; (c) predicted masks; (d) estimated inner and outer boundary. The dashed lines denote the ground-truth and the solid lines denote the prediction. Blue dots denote the recovered saliency points of the iris, and green dots denote the recovered saliency points of the pupil.


