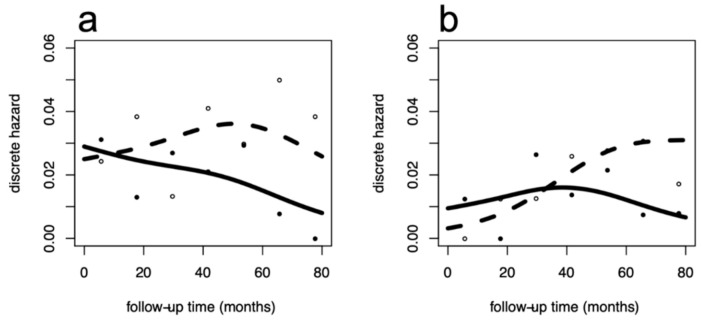
Figure 2.
Recurrence and overall mortality dynamics in the Canadian trial. Hazard rate patterns for Distant DFS (left panel: (a)) and OS (right panel: (b)) in the 242 patients considered in this trial. Discrete cause-specific hazard rates were estimated within a yearly interval, empirical estimates are represented as small open circles for no exercise and filled circles for exercise. Smoothed curves were obtained by flexible regression procedure based on generalized additive models, dashed lines for no exercise and continuous lines for exercise. X axis: time in months; y axis: discrete hazard rates (estimated yearly conditional event probabilities).

