Figure 5.
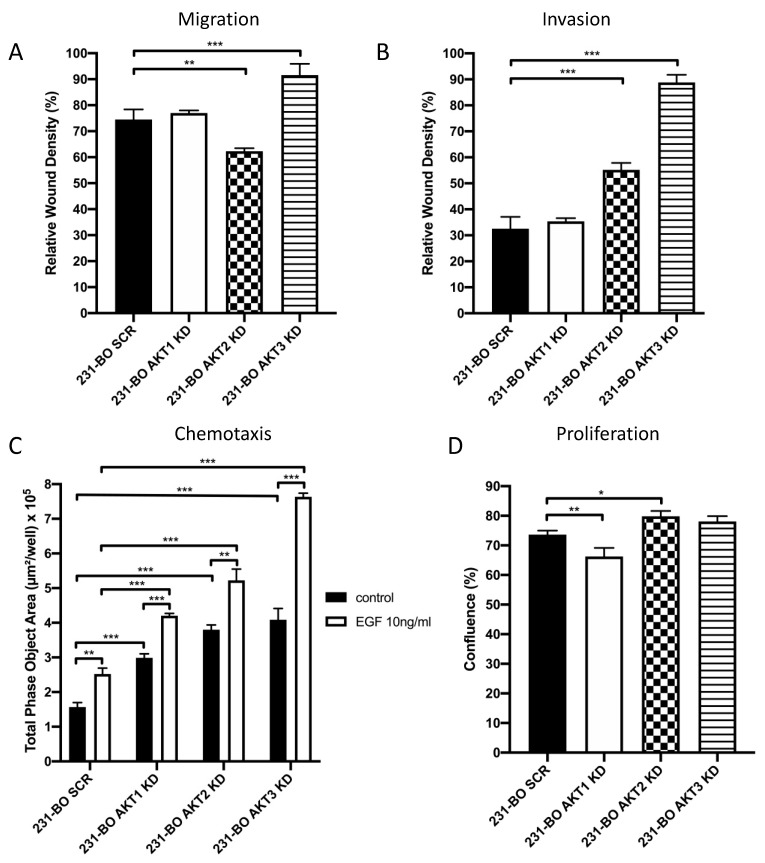
Knockdown of AKT3 in 231-BO cells promotes migration, invasion, and chemotaxis towards EGF but has no effect on proliferation: (A) Migration of 231-BO cells with AKT isoform knockdowns was tested using a wound healing scratch assay. Relative wound density was analyzed from triplicates by the IncuCyte live cell imaging system. Bars indicate mean with SD; ** = p < 0.01, *** = p < 0.001. (B) 231-BO AKT isoform knockdown cells were seeded in a 96 well plate in triplicate for invasion assay. Matrigel was added as an ECM after scratch wounds were created. The IncuCyte live cell imaging system was used to determine relative wound density. Bars indicate mean with SD; *** = p < 0.001. (C) Chemotaxis of 231-BO cells with AKT isoform knockdowns was tested with a Boyden chamber assay using the IncuCyte live cell imaging system. Cells were seeded in the upper chamber and EGF in a concentration of 10ng/mL was added to the lower chamber. Boyden chambers without an EGF gradient served as control. The area of the lower chamber occupied with transmigrated cells through pores was determined. Bars indicate mean with SD; ** = p < 0.01, *** = p < 0.001. (D) 231-BO cells harboring AKT isoform knockdowns were seeded in a 96-well plate and confluence was monitored with the IncuCyte live cell imaging system. Bars indicate mean with SD; * = p < 0.05, ** = p < 0.01.

