Figure 6.
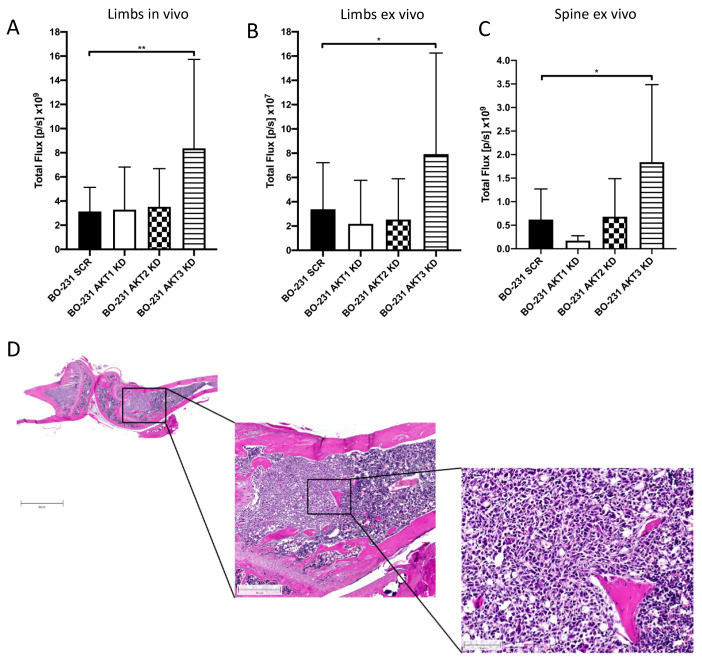
Knockdown of AKT3 in 231-BO cells shows increased metastasis to bone after intracardiac inoculation in NOD scid gamma (NSG) mice: To test the effect of AKT isoform knockdowns on metastasis in an in vivo model, 231-BO cells with AKT isoform knockdowns were transduced with a luciferase vector and were inoculated into the left ventricle of NSG mice. Correct injection, tumor cell dissemination, and growth were monitored by measurement of bioluminescence. Mice were sacrificed after 21 days, exenterated, and hind limbs as well as lumbar vertebrae were harvested. Bioluminescence intensities of hind limbs of living mice (SCR and AKT1 KD: n = 16; AKT2 KD and AKT3 KD n = 18) (A), of hind limbs ex vivo (SCR and AKT1 KD: n = 16; AKT2 KD and AKT3 KD n = 18) (B), and of the spine ex vivo (SCR and AKT1 KD: n = 8; AKT2 KD and AKT3 KD n = 9) (C) were measured by an IVIS imaging system after intraperitoneal luciferin injection. Bars indicate mean with SD; * = p < 0.05, ** = p < 0.01. (D) Right hind limbs were decalcified, embedded, and histological slices were generated. HE staining was used to confirm the presence of intraosseous tumor colonization. Image represents slices from a mouse injected with 231-BO AKT3 KD cells. Scale bars represent following dimensions: left image: 2000 μm; middle image: 500 μm; right image: 100 μm.

