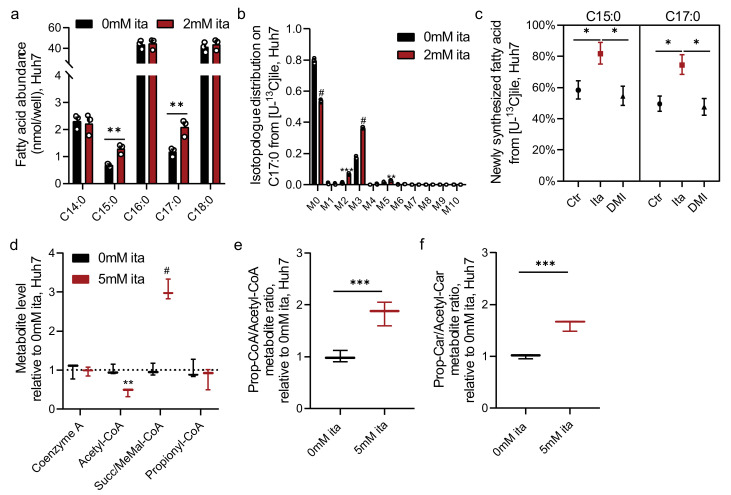
Figure 5.
Itaconate alters fatty acid diversity and CoA metabolism. (a) Levels of fatty acids in Huh7 cells cultured for 48 h in the presence of 2 mM ita. (b) Isotopologue distribution on C17:0 from [U-13C6]isoleucine in Huh7 cells after 48 h. (c) Newly synthesized C15:0 and C17:0 from [U-13C6]isoleucine in Huh7 cells exposed to itaconate or dimethyl-itaconate (DMI) for 48 h. (d) Levels of CoA species in Huh7 cells exposed to 5 mM itaconate for 48 h compared to 0 mM itaconate (dotted line). MeMal-CoA; Methylmalonyl-CoA. (e) Propionyl-CoA to acetyl-CoA metabolite ratio in Huh7 cells after 48 h. (f) Propionyl-carnitine to acetyl-carnitine metabolite ratio in Huh7 cells after 48 h. Data are depicted as box and whiskers (d–f), mean ± s.e.m. (a,b) or 95% confidence intervals from ISA model (c) obtained from 3 cellular replicates. Students t-test (a,b,d–f) with no adjustment for multiple comparisons * p < 0.05, ** p < 0.01, *** p < 0.001, # p < 0.0001. Significance was considered as non-overlapping confidence intervals for (c).

