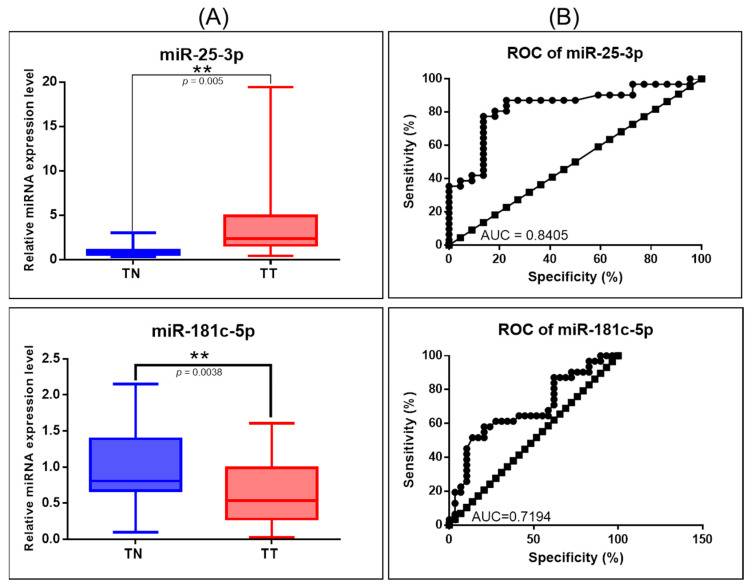
Figure 6.
miRNA targeting key Hippo signaling genes in OC. (A) Scatter plots demonstrating the upregulation of miR-25-3p and downregulation of miR-181c-5p in tumor tissues versus normal adjacent tissues. We used for normalization of the miRNA expression data, U6 and RNU48 as the internal controls (** p ≤ 0.01); (B) ROC curve for miR-25-3p and miR-181c-5p.

