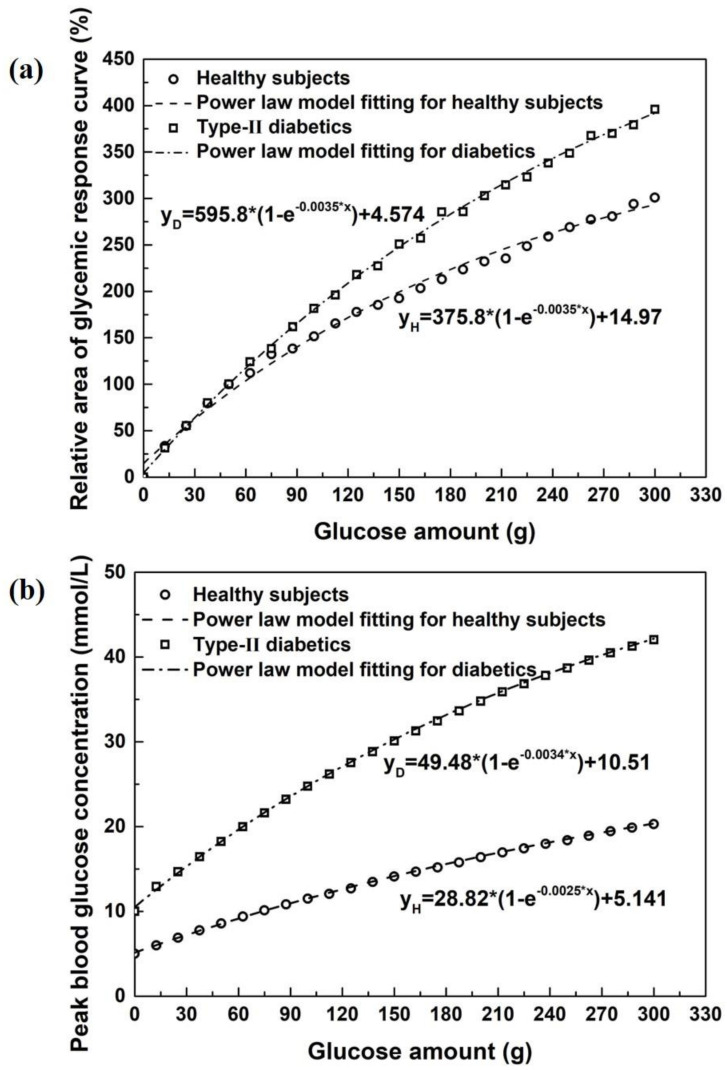
Figure 1.
The relative glucose area (RGA, a) under the glycemic curve (defined as the net area under the glucose curve after ingestion of a specified serving size of a meal or a ready-to-eat food product divided by the net area under the glucose curve after ingestion of 50 g glucose) and the peak blood glucose concentration (PGC, b) in healthy and diabetic subjects. The peak glucose concentration in mmol/L is very useful as it directly corresponds to the reading of the value on a standard glucometer. The RGA and PGC are derived from the glycemic response curves, which are predicted based on the spatiotemporally distributed intestinal absorption model coupled with an established glucose–insulin regulation system [15,16].

