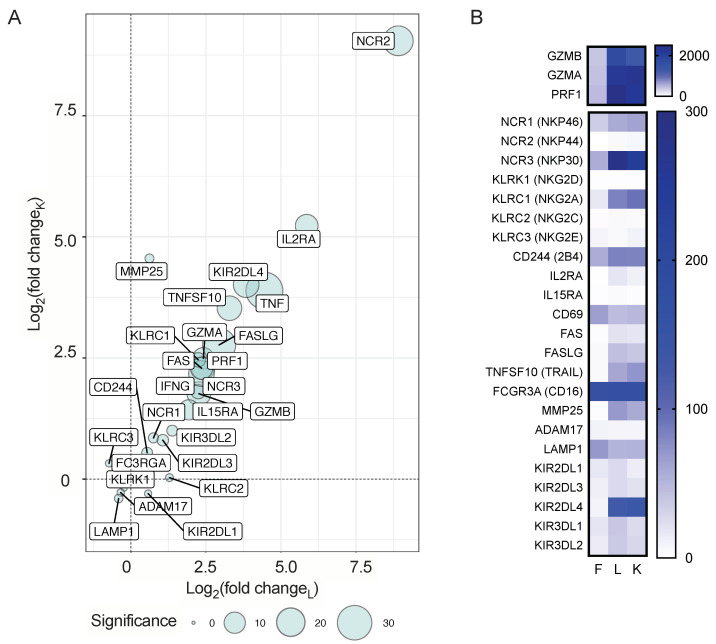
Figure 2.
Ex vivo expansion of NK cells leads to a highly significant transcriptional alterations in genes that are crucial for NK cell cytotoxicity. (A) Bubble plot that displays genes that control NK cell cytotoxicity. Axis values represent log2-transformed fold change of transcript expression in expanded NK cells compared to fresh NK cells, where L = LCL-expanded NK cells and K = GE-K562-expanded NK cells. The size of the bubble corresponds to the log10-transformed adjusted p value to denote the statistical significance of differential expression, based on LCL-expanded NK cell values. (B) Heat maps that display Fragments Per Kilobase of exon model per Million mapped reads (FPKM) values of the genes that are graphed in (A).

