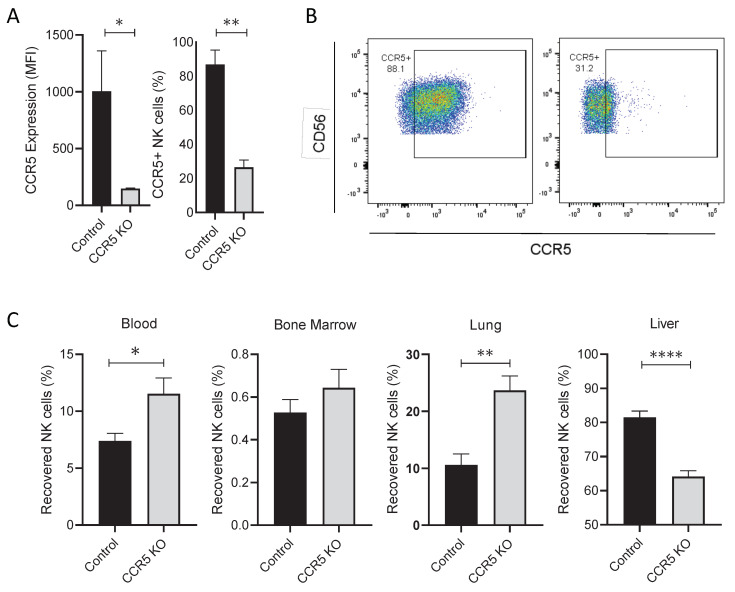
Figure 6.
Reduction of CCR5 expression significantly reduces NK cell trafficking into the liver 24 h following NK cell infusion into mice. (A) Bar graphs that illustrate CCR5 positivity and surface expression on ex vivo expanded NK cells (n = 4 donors). (B) Dot plots representing CCR5 surface expression on NK cells (one representative donor). (C) Plots displaying the fraction of NK cells that were recovered in tissues, 24 h following i.v. infusion into mice (n = 8–9 mice per group, 2 independent experiments). Statistics determined with the Students t-test, two tailed, * p < 0.05, ** p < 0.01, **** p < 0.001.

