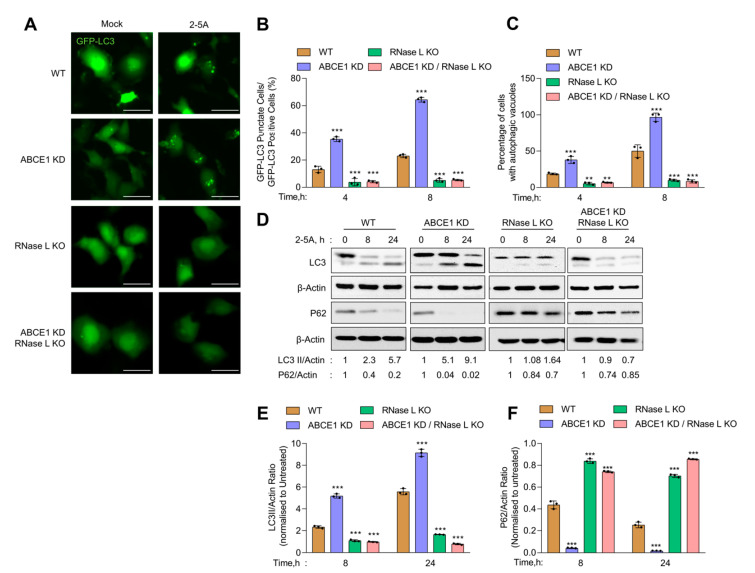
Figure 2.
Early onset of autophagy in ABCE1 KD cells on RNase L activation. HT1080 WT, ABCE1 KD, RNase L KO, and ABCE1 KD/RNase L KO cells expressing GFP-LC3 were mock-transfected or transfected with 2-5A (10 µM) and (A) the formation of GFP-LC3 puncta was microscopically imaged after 8 h; scale bar 50 µm. (B) The percent of GFP+ cells showing puncta formation compared with mock-treated cells was analyzed. (C) Autophagy induction in live cells was evaluated by staining autophagic vacuoles and quantified. Results shown represent mean ± SD for the experiment performed in triplicate and shown as the percent cells showing autophagic vacuoles from randomly selected fields. (D) Cell lysates were harvested at indicated times, and the conversion of unconjugated LC3-I to lipidated LC3-II and degradation of p62 were monitored on immunoblots and normalized to β-actin levels. (E,F) The band intensity was calculated using Image J software, and the ratio of LC3-II/β-actin or p62/β-actin was determined and the levels were compared to WT cells. Results are representative of three independent experiments. WT: wild-type; ** p < 0.01; *** p < 0.001.

