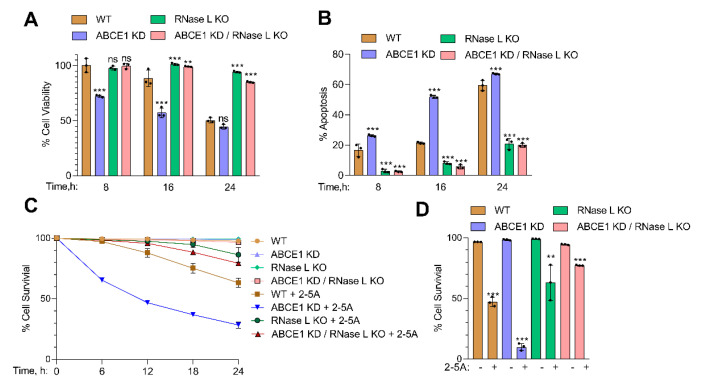
Figure 3.
Involvement of ABCE1 in RNase L-induced apoptosis in response to 2-5A treatment. HT1080 WT, ABCE1 KD, RNase L KO, and ABCE1 KD/RNase L KO cells were transfected with 10 µM of 2-5A for indicated times and (A) cell viability was measured using MTS reagent. (B) The percent of apoptotic cells was determined by trypan blue dye exclusion assay. Results are representative of three independent experiments performed in triplicate and shown as mean ± SD and compared to WT cells; and (C) real-time cell viability was measured over time using a dual dye monitoring system in cells transfected with 2-5A and compared to mock-transfected cells. The percent cell survival in each well was determined by quantitating dead cells and normalized to the total number of cells at each time point. Data are representative of four values per well performed in triplicate from three experimental samples and shown as mean ± SD. (D) Quantitation of percent cell survival at 30 h after 2-5A transfection normalized to mock-transfected cells. WT: wild-type; ** p < 0.01; *** p < 0.001; ns: not significant.

